OneFS S3 Bucket Lifecycle Management

Introduced in OneFS 9.14, the PowerScale S3 Lifecycle Management feature enables policy‑driven object management within PowerScale S3 buckets by supporting the automated deletion of objects based on administrator‑defined criteria such as object age, size, or key prefix. These lifecycle policies are applied consistently to both existing and newly created objects within a bucket. Backend processing is managed by the OneFS Job Engine, which performs daily evaluations of configured lifecycle rules and creates per‑bucket tasks to traverse bucket directories and remove objects that meet the specified conditions.

Newly introduced S3 API support in OneFS 9.14 and later includes the following endpoints:

API Endpoint Description
PutBucketLifecycleConfiguration Sets the lifecycle configuration for the bucket and replaces any existing one. User must be the bucket owner to create the lifecycle configuration.
GetBucketLifecycleConfiguration Returns the current lifecycle configuration for the bucket. User must be the bucket owner to get the lifecycle configuration. Will return a ‘NoSuchLifecycleConfiguration’ error if a configuration is not found.​
DeleteBucketLifecycle Deletes the lifecycle configuration for the bucket. User must be the bucket owner to delete the lifecycle configuration.

Additionally, the following S3 endpoints are also updated in the OneFS 9.14 release and require the following read and write permissions:

S3 Endpoint Read Permission Write Permission
CompleteMultiPartUpload x x
CopyObject x x
GetObject x
HeadObject x
PutObject x x

Note that all the above operations have an updated ‘x-amz-expiration’ response header if ‘objectexpiration’ has been configured. For example:

HTTP/1.1 200 OK​

…​

x-amz-expiration: expiry-date="Wed, 30 Apr 2027 00:00:00 GMT",rule-id=“3024"​

Content-Length: 434234​

Content-Type: text/plain

S3 bucket lifecycle behavior In OneFS 9.14 enables the bucket owner to define lifecycle management policies that are enforced using root‑level credentials. Lifecycle processing respects object lock protections, ensuring that immutable objects are preserved and not subject to deletion. Lifecycle rules may define expiration based on either a relative time period measured in days since the object’s last modification or an absolute date and timestamp, and can incorporate filtering criteria based on object size and key prefix, including support for backdated expiration rules. Each bucket supports a maximum of 1,000 lifecycle rules.

Note that the OneFS CLI, WebUI, or platform API do not currently support bucket lifecycle configuration, which can only be performed though the S3 API. Additionally, object tag–based filtering is not supported in OneFS 9.14, nor are object transition policies, ‘ExpiredObjectDeleteMarker’ configurations, noncurrent version expiration or transition rules, or versioned objects.

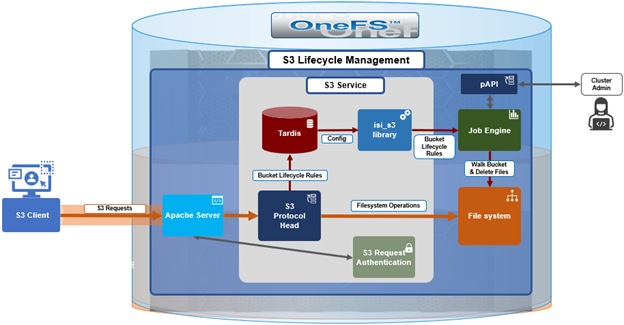
Under the hood, the core S3 bucket lifecycle management architecture is as follows:

At a high level, an S3 client sends a request containing the desired lifecycle rule(s), and the cluster’s S3 protocol head saves that into OneFS’ Tardis configuration database. The OneFS Job Engine retrieves the lifecycle configuration and then proceeds to walk the bucket and file structure, deleting files based upon the expressed rules.

The lifecycle processing is handled by the ‘S3Lifecycle’ job, which, by default, runs daily at 1:00 AM. Scheduling and priority for this job are optionally configurable through the OneFS CLI by a privileged local user:

# isi job types view S3Lifecycle

         ID: S3Lifecycl

Description: Manage S3 object lifecycle per bucket lifecycle policy.

    Enabled: Yes

     Policy: LOW

   Schedule: every day at 1:00am

   Priority: 6

During execution, the job logs all deleted objects and generates an S3Lifecycle job report, which can be viewed with the following OneFS CLI command:

# isi job reports view <job id>

Job report output is along the lines of the following:

S3Lifecycle[22] phase 1 (2026-04-30T11:18:06)​

---------------------------------------------​

Files 3​

Directories 1​

Apparent size 5300​

Physical size 52224​

Objects Deleted 2​

Objects Evaluated 3​

Objects No Action 1​

JE/Error Count 0​

JE/Time elapsed 3 seconds​

JE/Time working 3 seconds​

​

S3Lifecycle[22] Job Summary​

---------------------------​

Final Job State Succeeded​

Phase Executed

As above, this report summarizes the number of objects deleted and skipped, and logs detailed information about all deleted objects to /var/log/isi_job_d_s3_lifecycle.log.

The following table outlines the parameters that are supported for use within the lifecycle XML configuration body.

Configuration​ Description​
ID​ Unique identifier for the rule​.
Status​ If ‘Enabled’, the rule is currently being applied. If ‘Disabled’, the rule is not currently being applied. This is a mandatory field.​
Expiration​
  • Date​
Specifies expiration of the object in the form of date timestamp.​
  • Days​
Specifies expiration of the object in the form of days​.
Filter​
  • ObjectSizeGreaterThan​
Minimum object size to which the rule applies​.
  • ObjectSizeLessThan​
Maximum object size to which the rule applies​.
  • Prefix​
Prefix identifying one or more objects to which the rule applies.​
  • And​
Apply a logical ‘AND’ to two or more rules inside the operator​.

The ‘PutBucketLifecycleConfiguration’ request takes the following form:

PUT /?lifecycle HTTP/1.1​

Host: Bucket.s3.amazonaws.com​

x-amz-expected-bucket-owner: ExpectedBucketOwner​

<?xml version="1.0" encoding="UTF-8"?>​

<LifecycleConfiguration xmlns="http://s3.amazonaws.com/doc/2006-03-01/">​

    <Status>Enabled</Status>​

        <Rule>​

            …​

        </Rule>​

        <Rule>​

            …​

        </Rule>​

</LifecycleConfiguration>

As for the rules themselves, these can be temporal in nature. For example, expressing expiration as a date and/or time box:

<Rule>​

    <Expiration>​

    <Date>2029-03-02T12:30:00</Date>​

    <Days>365</Days>​

    </Expiration>​

</Rule>

The ‘date’ tag can be used to specify a time stamp, so objects in the bucket that exist during that date expression (for instance, 12:30 on March 2nd, 2029 in the example above) will be deleted. The ‘date’ tag can include a date in the past. In addition to an explicit date, a rule can also include a ‘days’ tag, which, in the example above, targets objects that haven’t been modified in 365 days, marking them for deletion.

Rules can also specify maximum and/or minimum object size in bytes. For example, greater than 1KB (1024) bytes but less than 50KB (51200 bytes):

<Rule>​

    <Filter>​

    <ObjectSizeGreaterThan>1024</ObjectSizeGreaterThan>​

    </Filter>​

<Rule>​

</Rule>​

    <Filter>​

    <ObjectSizeLessThan>51200</ObjectSizeLessThan>​

    </Filter>​

</Rule>​

Rules filters can also specify data locality. For example:

<Rule>​

<Filter>​

    <And>​

        <ObjectSizeGreaterThan>18124</ObjectSizeGreaterThan>​

        <ObjectSizeLessThan>92686</ObjectSizeLessThan>​

<Prefix>/data/path/</Prefix>​

    </And>​

</Filter>​

</Rule>

Note that, when specifying more than one filter, they must be wrapped in the <And> element, as above.

A bucket’s lifecycle configuration can be queried with the ‘GetBucketLifecycleConfiguration’ request. For example:

GET /?lifecycle HTTP/1.1​

Host: Bucket.s3.amazonaws.com​

x-amz-expected-bucket-owner: ExpectedBucketOwner

In contrast, a lifecycle can also be removed with the ‘DeleteBucketLifecycle’ request. For example:

DELETE /?lifecycle HTTP/1.1​

Host: Bucket.s3.amazonaws.com​

x-amz-expected-bucket-owner: ExpectedBucketOwner

In addition to bucket lifecycles, OneFS 9.14 also provides lifecycle management for incomplete S3 MPU operations. Specifically, this is the ability to craft lifecycle rules which clean up incomplete multipart uploads, helping reclaim space from abandoned large object transfers.

Configuration​ Description​
AbortIncompleteMultipartUpload​
  • DaysAfterInitiation​
Number of days after the system aborts an incomplete MPU​.

Rule parameters include the number of days after MPU initiation and the data path prefix. For example:

<Rule>​

    <AbortIncompleteMultipartUpload>​

        <DaysAfterInitiation>7</DaysAfterInitiation>​

    </AbortIncompleteMultipartUpload>​

<Filter>​

        <Prefix>/path/to/data/</Prefix>​

    </Filter>​

</Rule>

Note that the ‘DaysAfterInitiation’ parameter is limited in scope to incomplete multipart uploads (MPUs) and does not apply to standard objects or completed MPU uploads, while the lifecycle expiration rules similarly exclude incomplete MPUs.

In the next article in this series, we’ll look at some practical examples of how to configure, use, and validate S3 bucket lifecycle management in OneFS 9.14 and later releases.

OneFS Inline Compression Versus Incompressible Data

PowerScale OneFS inline compression is a native data reduction feature that operates in the write path to improve storage efficiency by compressing data before it is written to disk. This helps OneFS drive data reduction efficiencies to support PowerScale’s contract-backed 2:1 data reduction ratio (DRR) guarantee. Plus, many workloads and deployments achieving substantially higher ratios in practice, including EDA up to 6.5:1 compression and life sciences up to 4:1 compression.

As part of a multi-stage pipeline that includes zero-block elimination and inline deduplication, OneFS evaluates data in 128 KB regions and selectively compresses those that achieve useful space savings, storing them as compact encoded containers while leaving incompressible data unmodified.

Because this process occurs inline, it not only influences capacity utilization, but also CPU consumption, write latency, and on-disk data layout. When used with suitably compressible workloads, inline compression can significantly reduce physical I/O and increase effective cluster capacity. However, its impact on performance and data placement calls for understanding and careful consideration, particularly for workloads with low compressibility or frequent small updates.

Inline compression is often a beneficial optimization, with modest additional CPU overhead reducing physical I/O demands while increasing effective storage capacity. For many workloads, this expectation holds true. However, for incompressible data sets, enabling OneFS inline compression can negatively impact performance as compared to running with no compression at all, and the penalty doesn’t abate instantly upon disabling the feature.

So for data such as encrypted backups, already-compressed media, highly random content, or when randomly overwriting data that was previously written in a compressed layout, performance can degrade in ways that are predictable once the underlying on-disk activities are understood. The crux is that inline compression is not just a logical efficiency feature. It changes how data is laid out and how writes are handled. That means the impact is not limited to capacity savings, since it can also influence write throughput, overwrite behavior, and the cost of small updates into existing files.

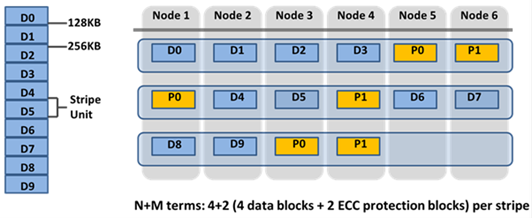
Without inline compression, OneFS stores data in 8 KB blocks, grouped into protection groups (e.g. 4+2 on a six node cluster/pool with a +2n FEC protection policy).

A 128 KB logical range (stripe unit) comprises 16 × 8 KB blocks laid out as plain data or parity blocks. Conversely, with inline data reduction enabled, every incoming write flows through a multi-stage pipeline before it ever touches disk:

Order Stage Description
1 Zero block removal Fully-zero 8 KB blocks are detected and stored as sparse references rather than real blocks.
2 Inline dedupe 8 KB blocks are fingerprinted and matched against an in-memory hash table; duplicates are collapsed to shared references.
3 Inline compression Surviving 128 KB regions are handed to the compression engine (zlib or lz4 depending on platform), which decides per-region whether the result is small enough to keep.
4 Protection and layout Whatever comes out the other side (compressed container, deduped reference, or plain blocks) is then protected with FEC and laid out across the cluster.

Note that every stage in this pipeline consumes cluster resources (CPU, etc) and adds write-path latency on every write – before OneFS knows whether it will deliver a benefit. Two things change on disk as a result:

  1. Data is chunked into 128 KB compression regions. Each region maps to 16 logical 8 KB blocks, and this is what the compression engine actually works on.
  2. Compressible regions are stored as compressed containers. When a 128 KB region compresses well enough, OneFS encodes it into a smaller bytestream using a node-specific algorithm (zlib, lz4, etc., fixed per platform and OneFS release). That region is no longer stored as 16 individual blocks, instead becoming a single compressed container.

Compressed regions are reported via the ‘isi get -DDO’ CLI command, as follows:

lbn 160: 10+2/2

...

5,5,1403920384:8192[DIRTY,COMPRESSED]#2

(sparse)[DIRTY,COMPRESSED]#3

...

{ebns={160,161},lbns={160,161,162,163,164},

encoded_size=10762,encoded_offset=0,

decoded_blocks=5,format=zlib}

The ‘encoded_size’ parameter returns the compressed byte count while ‘decoded_blocks’ reports how many logical 8 KB blocks live inside. The file looks identical from the outside, but, physically, the layout is where things get interesting since OneFS doesn’t know data is incompressible until it attempts to compress it. So even for data that will never compress, the engine still:

  1. Takes the 128 KB chunk.
  2. Runs it through the compression algorithm.
  3. Checks if compressing the chunk does save at least one full 8 KB block.
  4. Falls back to writing it as a chunk of normal, uncompressed 8 KB blocks.

On disk, those blocks show up tagged as ‘INCOMPRESSIBLE’. For example:

lbn 0: 10+2/2

...

6,2,1176543232:8192[DIRTY,INCOMPRESSIBLE]#16

...

1,5,1075085312:8192[DIRTY,INCOMPRESSIBLE]#12

No {encoded_size=…, decoded_blocks=…, format=…} stanza — just plain blocks. But the cluster still expended CPU and latency as a cost of trying. That overhead is real, and on CPU-constrained A-series archive nodes, it can show up directly in throughput.

That said, OneFS inline compression can be easily disabled entirely via the following CLI syntax:

# isi compression settings modify --enabled=False

With the ‘–enabled’ parameter set to ‘False’, new writes automatically skip the compression stage completely. Each 128 KB region goes straight to disk as plain 8 KB blocks — no attempt, no fallback, no overhead. The on-disk layout looks identical to the incompressible case above (without the INCOMPRESSIBLE tag), but the ‘attempted compression’ overhead never affected the write path.

However, note that disabling compression is not retroactive. Disabling compression afterwards doesn’t decompress or rewrite (re-lay-out) those regions in the background. That’s why you can disable compression cluster-wide and still see what looks like ‘compressed behavior’ on overwrites to older data. These regions can be identified by their ‘[COMPRESSED]’ tags and the compression metadata block in output from the ‘isi get -DDO’ CLI command.

With compression enabled, every write still flows through the full pipeline (zero-block removal > dedupe > compression) regardless of whether the data ends up compressed or uncompressed on disk. Hence, the latter case incurs  CPU overhead and write-path latency for no additional space savings.

On platforms like the PowerScale A310, this translates to a measurable throughput drop for workloads dominated by encrypted backups, already-compressed files, or just very random data. Disabling compression and re-running against fresh data will often result in write throughput increasing noticeably.

Note that the penalty for incompressible data is often more significant than for genuinely compressible or dedupe-able data. When data compresses or deduplicates well, inline data reduction actually reduces the amount of physical I/O hitting the drives, due to fewer blocks to write, less parity to compute, less backend traffic. The CPU overhead is more than offset by the I/O savings, resulting in better throughput and lower latency than without data reduction at all. In contrast, uncompressible data yields none of that I/O relief, but only the overhead.

When over-writing existing compressed data, a compressed region is a 128 KB atomic unit. This means that even a 4 KB update in the middle of a region will force OneFS to:

  1. Read the full 128 KB compressed container.
  2. Decompress it in memory.
  3. Merge the changed bytes.
  4. Re-encode and rewrite the full 128 KB region.

This read–decompress–modify–rewrite (R-DM-W) penalty applies even with inline compression disabled compression. If the region on disk was written compressed, the overwrite path still must treat it that way until the full file is physically rewritten with an uncompressed layout.

Even over-writing regions that are ‘incompressible’ incur an overhead. Because a file written with compression enabled may contain a mix of compressed and uncompressed (incompressible) regions, OneFS has to route partial-chunk overwrites through the compression stage to stay consistent across the 128 KB boundary. It can’t know ahead of time whether a given 128 KB range is fully uncompressed, so it has to treat the whole chunk conservatively.

This means that even ‘incompressible regions (i.e. data that never compressed in the first place) still carry a partial-overwrite penalty if compression was enabled when the file was initially written. Only a full 128 KB chunk replacement can safely bypass the compression engine entirely for that region, which is usually achieved by overwriting the file completely. This often manifests itself as:

  • New writes returning to full speed immediately upon disabling compression.
  • Overwrites remaining sluggish until the underlying data is physically rewritten as uncompressed — regardless of whether the on-disk blocks are tagged ‘[COMPRESSED]’ or ‘[INCOMPRESSIBLE]’.

Investigating and troubleshooting unexpected performance with inline compression typically involves:

  1. First, confirming whether the data is actually compressible by verifying data reduction statistics at the cluster or path level:
# isi statistics data-reduction view

# isi compression stats view

# isi_storage_efficiency /ifs/path/to/file

If compression is ‘enabled’ but little to no space savings are evident, the data almost certainly isn’t compressible.

  1. Next, check the actual on-disk layout:
# isi get -DDO /ifs/path/to/file

Specifically, the ratio of ‘[COMPRESSED]’ to ‘[INCOMPRESSIBLE]’ tags in the ‘PROTECTION GROUPS’ section, and the ‘Metatree logical blocks:’ summary at the end.

  1. Separate new writes from overwrites when testing:

This is the most important thing to get right when benchmarking. Use fresh test files written after any compression settings reconfiguration, and run tests in two distinct phases:

  • Phase 1 — Initial write (e.g. –overwrite=0 in fio)
  • Phase 2 — Overwrite / update (e.g. –overwrite=1 with random updates into the same files)

The following is a simple example ‘fio’ test overwriting an existing file at random offsets:

fio --name=random-update \

--filename=data.bin \

--rw=randwrite \

--bs=1M \

--size=10G \

--direct=1 \

--overwrite=1 \

--ioengine=libaio \

--iodepth=64

Then compare:

Test What it reveals
Initial writes: compression on vs. off The cost of the “try to compress” overhead
Overwrites into files written with compression on The R-DM-W penalty on legacy compressed regions
Overwrites into files written with compression off Your true baseline uncompressed overwrite performance
  1. Rule out unrelated bottlenecks.

Before assuming a compression issue, validate that the cluster is not hitting CPU, disk, or network limits for other reasons:

# isi statistics system list --nodes=all --format=top

# isi statistics drive list --format=top --sort=Queued

# isi statistics client list --format=top

# isi statistics protocol list --format=top

The goal is to distinguish between hitting the limits of the compression design from saturating the hardware. Having confirmed that legacy compressed layout is hurting performance, disabling compression, then physically rewriting the data is generally the cleanest approach. The following options can be used to ‘rehydrate’ the data back to a regular uncompressed layout.

1. Disable compression globally (or via file pool policy)

# isi compression settings modify --enabled=False

2. Or rewrite via intra-cluster copy using the ‘cp’ CLI command:

# cp -a /ifs/source/path /ifs/target/path

3. Use SyncIQ or SmartSync to replicate/copy to another /ifs location within the cluster.

Once rewritten, the ‘isi get -DDO’ CLI will show only uncompressed blocks, and overwrites follow the efficient block-level path rather than a read-decompress-modify-write (R-DM-W) operation.

4. If rewriting from the application is impractical, the SmartPoolsTree job can be used instead. Note that this method requires SmartPools to be licensed across the cluster, and the job settings configured as follows:

a) Set the SmartPoolsTree job to a ‘retune’ restriping strategy via gconfig:

# isi_gconfig -t job-config jobs.types.smartpoolstree.find_goal=retune

# isi_gconfig -t job-config jobs.types.smartpoolstree.restripe_goal=retune

b) Then run against the target path

# isi job start SmartPoolsTree --paths=/ifs/path/to/data

Or, for a more direct, non-job-engine approach, use isi set (no SmartPools license required):

# isi set -r -g retune /ifs/path/to/data

5. Alternatively, if SmartPools is unlicensed or using the job engine is undesirable, for a more direct, the ‘isi set’ CLI command can be used as follows:

# isi set -r -g retune /ifs/path/to/data

Note the case sensitivity of the ‘isi set’ ‘-r’ and ‘-R’ flags: The lowercase ‘-r’ flag forces an immediate restripe of the file using the specified goal (-g retune), effectively decompressing and re-laying-out the data without going through the job engine. The uppercase ‘-R’ flag applies the goal recursively to an entire directory tree, which can be an extremely time-consuming operation with little visibility or control over speed and duration. Scripting ‘isi set -r -g retune’ to iterate over a list of hot files or a specific subdirectory is typically preferred, providing improved control. Because this operation trades background I/O and capacity (by giving back compression savings), it’s best targeted at specific uncompressible or otherwise hot datasets rather than an entire archive tier.

Inline data reduction in OneFS can be highly beneficial for the appropriate workloads, but its underlying on-disk behavior can lead to unexpected outcomes if unfamiliar with its operation. Key takeaways include:

  • Incompressible data still incurs a compression cost when compression is enabled: CPU resources are consumed and write-path latency increases even when no actual space savings occur. In some cases, this overhead can be more impactful than with compressible data. When data compresses or deduplicates effectively, reduced I/O often offsets CPU usage and can even improve performance. With incompressible data, however, there are no such benefits—only added overhead.
  • Both compressed and incompressible regions are subject to read–decompress–modify–write (R-DM-W) overhead on every overwrite, regardless of the current compression setting.
  • Turning off compression benefits new writes right away, but it does not change the layout of data that was already written in a compressed format.
  • Data originally written as incompressible continues to experience 128 KB partial-chunk overhead during partial overwrites until those areas are either fully overwritten or the entire file is replaced.
  • A solid understanding of how OneFS implements data reduction—and a clear view of your workload characteristics before enabling it—helps avoid these pitfalls entirely.

As with many things in life, compression usage is a cost-benefit conundrum. Once the underlying mechanics are understood, their behavior is consistent and predictable. The key is to evaluate, measure, and quantify, and apply the knowledge and findings proactively, rather than reacting after performance issues arise in production.

OneFS S3 Multi Part Upload Completion Status Tracking

The previous article in this series provided an overview of the S3 multipart upload (MPU) functionality in PowerScale OneFS. Now, we’ll turn our attention to extended MPU functionality introduced in OneFS 9.13, which allows PowerScale S3 users to track the status and completion progress of their MPU completion in real time.

MPU Completion is an existing standard S3 API that has been extended to return three additional response headers, Completion‑Id, Fast‑Path, and Completion‑State‑Info, when MPU completion progress tracking is enabled. MPU Completion Progress is a newly added extended S3 API that reports real‑time progress information in the response, including whether the fast path is used, the total number of parts and recovery parts, and the counts of completed and recovered parts.

Disabled by default, MPU completion progress activation on a PowerScale cluster is controlled by the boolean ‘MPUCompletionProgressEnable’ gconfig parameter, which must be set to value ‘1’, followed by a restart of the S3 service, for it to take effect. The CLI syntax for this procedure is as follows:

# isi_gconfig registry.Services.lwio.Parameters.Drivers.s3.MPUCompletionProgressEnable=1

# isi services s3 disable

# isi services s3 enable

Starting with OneFS 9.13, multipart upload (MPU) completion can follow either a fast or slow path based on part integrity and ordering, with fast‑path completion occurring when all parts are the same size except possibly the last, parts are retransmitted only in the event of failure while preserving their original sizes, every uploaded part is included in the final object, and part numbers are contiguous beginning at 1 with no gaps. When these conditions are satisfied, OneFS performs a highly optimized assembly process. If any condition is violated, OneFS falls back to the slow path, which requires more processing time.

OneFS 9.13 and later also include the following completion progress API endpoint:

GET /{bucket}/{object-key}?completionId=<completionId>&uploadId=<uploadId>

When progress tracking is enabled, the ‘CompleteMultipartUpload’ response includes a ‘completionID’, which is especially valuable for very large uploads where completion can take a noticeable amount of time, as it allows clients to determine whether the operation is using the fast or slow path, view the total number of parts involved, and retrieve real‑time completion metrics through the ‘Completion‑State‑Info’ data.

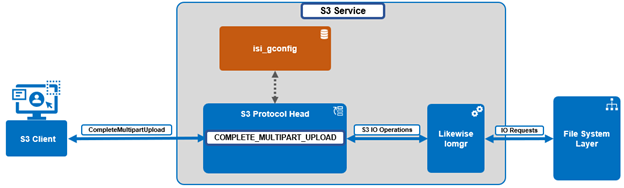
The components marked in green in the following diagram are introduced in OneFS 9.13, with ‘CompleteMultipartUpload’ used to assemble all the uploaded parts, and ‘GetMPUCompletionProgress’ to check the progress.

Component Action
S3 Protocol Head S3 Protocol Head processes requests from S3 clients.
Likewise Iomgr Likewise Iomgr provides IO APIs. Both MPU requests need to call the Iomgr in order to read and write progress status file(s).
FS Layer File system layer performs IO requests from upper layers.
Gconfig Gconfig is in charge of storing user configuration to enable or disable this feature.
Other The other components are mainly responsible for processing the two requests from S3 clients.

The following table details the various completion states:

Scenario Message Progress
Super fast path Super fast path with parts 1..N sequential, will finish quickly and completionID will be useless. No need to check
Fast path Fast path with parts 1..N sequential, but x parts need to be recovered. May fallback to slow path in case of errors. To check recovery progress
Slow path: only one part Not a fast path due to only one part in total and this part needs to be recovered. To check slow path progress
Slow path: part number not contiguous Not a fast path due to non-contiguous part numbers. Please verify intent, or abort and restart the session. To check slow path progress
Slow path: part number not from 1 Not a fast path due to part numbers not starting from 1. Please verify intent, or abort and restart the session. To check slow path progress
Slow path: different part size Not a fast path due to the size of non-last parts differs from the 1st part size. Please verify intent, or abort and restart the session. To check slow path progress

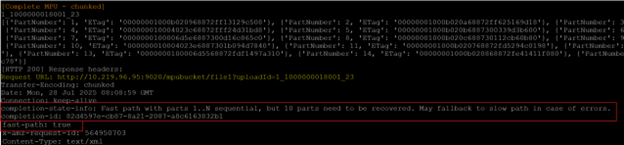
For example, the following shows the HTTP 200 response headers from a fast path MPU operation on a large file:

Pertinent information returned includes:

Attribute Example Output
completion-state-info: Fast path with parts 1..N sequential, but 10 parts need to be recovered. May fallback to slow path in case of errors.
completion-id: 82d4597e-cb87-8a21-2087-a8c6163632b1
fast-path: true

For non‑MPU objects, OneFS can compute MD5-based ETags when configured (use Md5 for Etag and Validate Content Md5).
Note that objects created via multipart upload do not use a simple MD5 hash as the ETag.
As with AWS S3, MPU ETags may be composite values, and applications requiring MD5 semantics must account for this.

When it comes to investigating and troubleshooting S3 MPU issues, the following error response codes can be helpful:

Status Description Troubleshooting
400 Bad Request Unexpected upload Id

Unexpected completion Id format

Check if  upload ID is correct.

Check if completion id is correct (it can be got from CompleteMPU response header), cannot be blank.

403 Forbidden No correct permission. Only bucket owner, MPU completion initiator, or users who have been granted READ/FULL_Control permissions on the bucket can do this operation.
404 NoSuchCompletionId Failed to find MPU complete progress. Check if the completion has already done.

Check if completion ID is correct (ID can be found in the CompleteMPU response header)


It’s also worth nothing that Multipart upload is distinct from SigV4 streaming (chunked upload, available in OneFS 9.3 and later), which controls how payloads are signed and transmitted rather than how objects are partitioned. SigV4 chunked transfer encoding can be used with or without MPU.

Comparison:

Characteristic Multipart Upload SigV4 Chunked Upload
Purpose Breaks object into logical parts Breaks HTTP payload into signed chunks
Identifiers uploadId, part numbers SigV4 per‑chunk signatures
Relationship Independent mechanisms Can be used together


So, in summary, OneFS S3 MPU follows the same client-facing operation and semantics as AWS S3:

CreateMultipartUpload → UploadPart / UploadPartCopy → CompleteMultipartUpload / AbortMultipartUpload, plus listing operations.

Internally, OneFS stores multipart upload segments in ‘.s3_parts_<uploadId>’, assembles those parts into the final object upon completion, and removes the part files after either completion or abort, while OneFS 9.13 and later add MPU enhancements such as fast‑ or slow‑path determination for completion and real‑time progress monitoring via ‘GetMPUCompletionProgress’, including response headers like ‘Completion-Id’ and ‘Fast-Path’.

OneFS S3 Multipart Upload

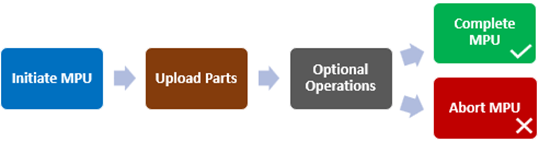
Within the ubiquitous AWS S3 protocol spec, multipart upload (MPU) allows a large object to be more efficiently accessed by splitting it into smaller parts that are uploaded independently. It is used to improve reliability and performance by enabling parallel uploads and retrying only failed parts instead of restarting the entire operation. MPU is typically employed for objects larger than 5GB, and supports objects up to 5TB in size and 10,000 parts. The process involves initiating a multipart upload to obtain an upload ID, uploading individual parts (which can occur in any order), and completing the upload so the service assembles the parts into a single object, with the option to abort the upload to discard any uploaded parts.

The PowerScale S3 protocol implementation has supported Multipart Upload (MPU) since OneFS 9.0, leveraging the ‘HTTP 100-continue’ header during upload initiation. MPU enables OneFS to ingest or copy large objects in discrete sections, which improves performance, resilience, and workflow flexibility.

Using MPU provides several advantages, including increased throughput by allowing multiple parts to be uploaded in parallel, reduced recovery time because only failed parts must be retransmitted after a network interruption, and the ability to pause and resume uploads over extended periods. There is no automatic expiration for an MPU, so it must be explicitly completed or aborted by the client. MPU also enables upload workflows in which the final object size is not yet known, allowing applications to begin transmitting data as it is generated.

When operating over a stable, high‑bandwidth network, multipart upload maximizes bandwidth utilization by distributing parts across parallel upload threads. On less reliable networks, MPU improves resilience by isolating network failures to individual parts, avoiding the need to restart the entire upload operation. OneFS S3 Multipart Upload allows clients to transfer large objects as a series of independent parts that are later combined into a final object. To support this workflow, OneFS implements the full set of standard S3 MPU operations, including:

Operation Definition
CreateMultipartUpload Initiates a new multipart upload and returns an ‘uploadId’ that uniquely identifies the MPU session. The client must reference this ‘uploadId’ for all subsequent part upload and completion operations.
UploadPart Uploads a single part of the object. The client specifies a ‘part number’ (1–10,000) and the ‘uploadId’. Each part is stored independently until the MPU is completed or aborted.
UploadPartCopy Creates a part by copying a range of bytes from an existing object instead of sending new data. The resulting copied part becomes part of the MPU associated with the specified ‘uploadId’ and ‘part number’.
ListParts Returns metadata for the parts that have already been uploaded for a given MPU. Useful for resuming interrupted uploads or verifying which parts have been received.
CompleteMultipartUpload Finalizes the MPU. The client submits an ordered list of ‘part numbers’ and associated ‘ETags’. The service assembles the parts into the final object and removes temporary part storage.
AbortMultipartUpload Cancels an in‑progress MPU and discards all previously uploaded parts associated with the ‘uploadId’. After aborting, the MPU cannot be resumed.
ListMultipartUploads Returns a list of all in‑progress multipart uploads within a bucket. Useful for monitoring active sessions or identifying abandoned uploads.

OneFS S3 MPU also adheres to the standard S3 limits which include the following:

Item Limit
Maximum number of multipart uploads returned in a list multipart uploads request 1000
Maximum number of parts per upload A maximum of 10,000 parts per object is permitted.
Maximum number of parts returned for a list parts request 1000
Maximum object size 5 TiB
Part numbers 1 to 10,000 (inclusive)
Part size 5 MB to 5 GB. There is no minimum size limit on the last part of a multipart upload.

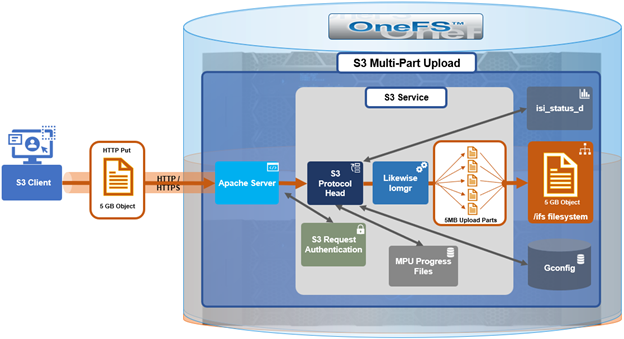
Under the hood, OneFS S3 MPU operates as follows:

Component Action
S3 Protocol Head S3 Protocol Head processes requests from S3 clients.
Likewise Iomgr Likewise Iomgr provides IO APIs.
FS Layer File system layer performs IO requests from upper layers.
Gconfig Gconfig is in charge of storing user configuration parameters.
Other The other components are mainly responsible for processing the two requests from S3 clients.

When an S3 multipart upload is initiated, OneFS creates a hidden ‘dot’ directory to store uploaded parts. The naming convention for this hidden directory is as follows:

.isi_s3_parts_<uploadId>

The hidden directory is placed under the bucket’s backing directory within the /ifs filesystem. For example:

# ls -lh .isi_s3_parts_1_1000000038001_1
total 276961
-rwx------ +   1 root  wheel   595M May 29 07:20 #31214989
-rwx------ +   1 root  wheel   1.0G May 29 07:27 #52428800
-rwx------ +   1 root  wheel     0B May 29 07:15 .1
-rwx------ +   1 root  wheel     0B May 29 07:27 .2
-rwx------ +   1 root  wheel     0B May 29 07:20 .3
-rwx------ +   1 root  wheel    50M May 29 07:37 1

Each uploaded part is saved as an individual ‘dot’ file within this directory and is keyed by its part number. During UploadPart or UploadPartCopy, the part is written to .isi_s3_parts_<uploadId>, associated with its part number (1–10,000), and the ‘uploadId’ returned by ‘CreateMultipartUpload’. Parts remain in this directory until the client completes the MPU, at which point they are assembled into the final object, or the MPU is aborted, which removes the part files and releases the associated space.

From the S3 client’s perspective, the MPU workflow operates as follows:

Action HTTP Request Details
Initiate MPU POST /bucket/object-key?uploads OneFS returns an uploadID and creates .s3_parts_<uploadId> internally.
Upload Parts PUT /bucket/object-key?partNumber=N&uploadId=<uploadId> Each part is written as a file inside the corresponding parts directory.
Optional Operations GET /bucket/object-key?uploadId=<uploadId>

GET /bucket?uploads

List part and/or List multipart uploads
Complete MPU POST /bucket/object-key?uploadId=<uploadId> The client provides an XML list of part numbers and ETags.
OneFS assembles the final object and removes the .s3_parts_<uploadId> directory and its contents.
Abort MPU DELETE /bucket/object-key?uploadId=<uploadId> OneFS deletes the stored parts and frees the associated space.

In the next article in this series, we’ll take a look at the MPU status tracking and reporting functionality that was introduced in OneFS 9.13.

PowerScale InsightIQ 6.3 Features – Part 2

In this final article in the InsightIQ 6.3 series, we’ll dig into the details of the additional functionality that debuts in this new IIQ release. This includes:

  • Support for monitoring virtual clusters deployed on AWS or Azure, allowing InsightIQ to monitor environments regardless of where the application itself is hosted.
  • Increased performance visibility for file and object workloads with support for granular protocol operations, enabling metrics to be analyzed and broken down by individual file and/or object actions to streamline troubleshooting of protocol-related issues.
  • Enhanced filtering capabilities, allowing multiple values per category, such as IP addresses, hosts, nodes, and protocols, making it easier to compare performance across multiple entities within the same time range.
  • Strengthened security and operational integration with Single Sign-On (SSO) support using SAML-based authentication through Microsoft ADFS or Azure Entra ID.
  • Direct, in-place upgrades from versions 6.1 and 6.2, simplifying the upgrade process for existing Scale and Simple deployments.

Granular Protocol Operations Breakouts

InsightIQ 6.3 introduces enhanced visibility into granular protocol-level operations through the addition of a new breakout for protocol operations. This capability is now available across all performance graphs that support operation class breakouts and includes detailed operation name breakouts for actions across both file and object, such as ‘get bucket’, ‘get object’, ‘get bucket ACL’, and related S3 operations. This is an equivalent set of operations statistics as provided by the following OneFS command:

# isi statistics pstat list --protocol s3

With this enhancement, users can navigate directly to performance graphs and select operation name breakouts to analyze workload behavior at a granular level. This enables identification of specific operations contributing to elevated latency or bandwidth consumption, as well as determining which operations occur most frequently. Such insights can inform operational decisions, including selectively throttling specific operations at the PowerScale layer when required.

Previously, supported graphs provided protocol-level and operation class-level breakouts. InsightIQ 6.3 extends this functionality by adding operation name-level (Op Name) visibility, allowing users to see the exact operations being executed while maintaining consistency with existing views.
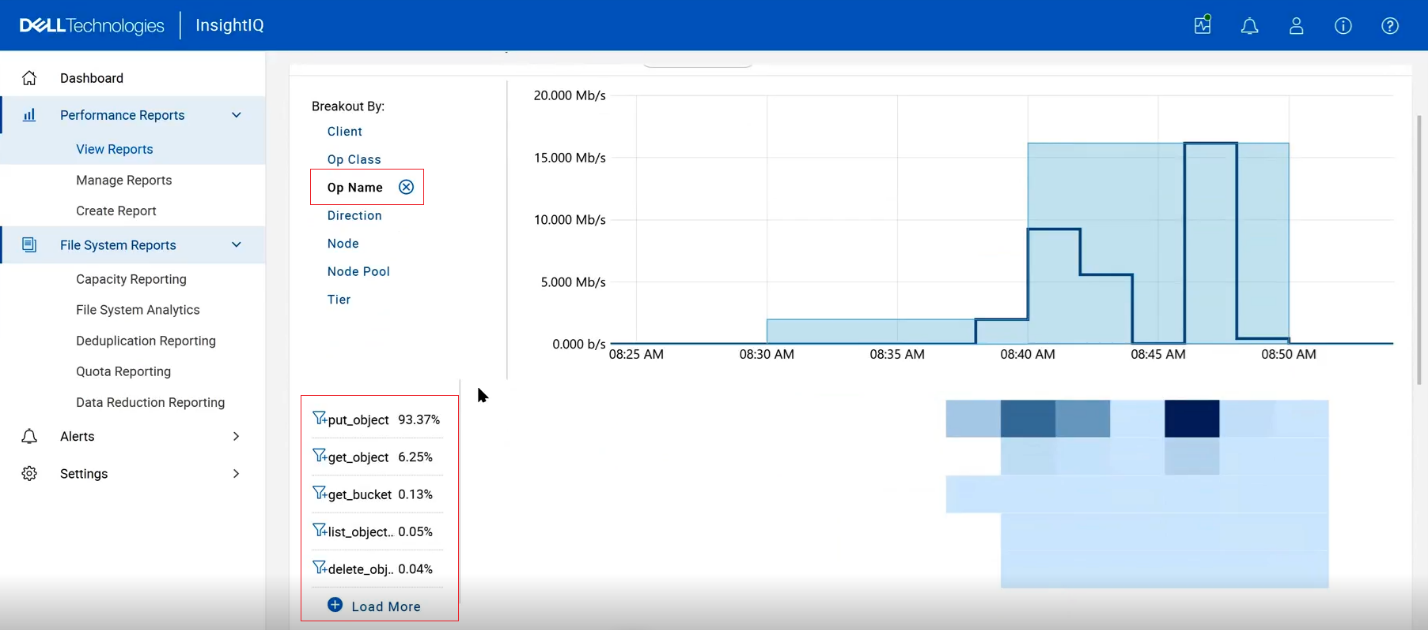
These operation name breakouts are also supported within cluster performance reports, enabling the same level of analysis in both interactive graphs and generated reports.

In addition, InsightIQ alerts can also now be configured using operation name (OP Name) filters with IIQ 6.3.
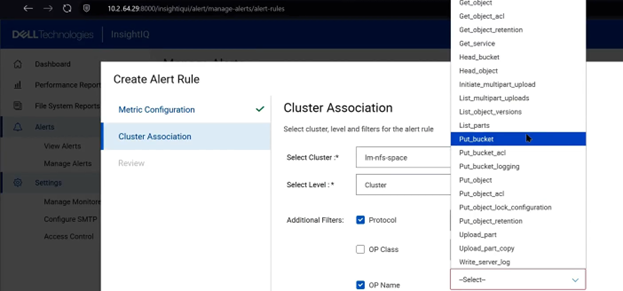
When defining alert rules, users may apply filters based on protocol, operation class, or specific operation names. For example, if an environment experiences a high frequency of access to a particular bucket or object, an alert can be configured specifically for the ‘get bucket’ operation to proactively notify administrators of anomalous or excessive activity.

This added granularity provides customers with significantly improved transparency into storage workloads. By exposing detailed operational metrics, including frequency, latency, and bandwidth consumption, cluster admins can more effectively identify performance bottlenecks, understand the root causes of slowdowns, and correlate workload behavior to observed performance impacts within the PowerScale cluster.

Operation names function as a subset of operation classes, which themselves are a subset of protocol performance data. This hierarchical relationship allows users to combine filters and breakouts to progressively refine analysis. For example, to analyze NFS workloads, a user may apply an NFS protocol filter and review operation class breakouts to determine whether read or write operations dominate performance time. Each operation class can then be further decomposed into individual operation names—such as specific read or object access operations—to gain deeper insight into workload behavior.

By combining protocol filters, operation class breakouts, and operation name breakouts, users can construct a highly detailed performance view that pinpoints which operations, protocols, or workload patterns contribute most significantly to latency or resource utilization.

As with existing protocol and operation class breakouts, operation name filters cannot be used in conjunction with interface-level filters. Additionally, operation name filtering is not supported with client-level filters due to limitations in OneFS telemetry data. Consequently, the system cannot report which specific client is responsible for a given operation, such as identifying which client initiated a particular ‘get object’ request.

The data presented through InsightIQ aligns with existing PowerScale CLI capabilities, such as output from the ‘isi statistics pstat list –protocol <protocol>’ command. However, while the CLI provides operation rates, InsightIQ extends this by presenting operation rates alongside bandwidth and latency metrics within a unified visualization. This delivers a more comprehensive and actionable view of protocol-level performance than was previously available through CLI data alone.

Multi-Value Breakouts

InsightIQ 6.3 introduces support for multi‑value selection within a single filter, enabling users to analyze multiple data sources simultaneously within a unified view. This enhancement allows multi‑line visualizations and aggregated insights to be presented together, simplifying side‑by‑side comparisons without requiring users to switch between views.
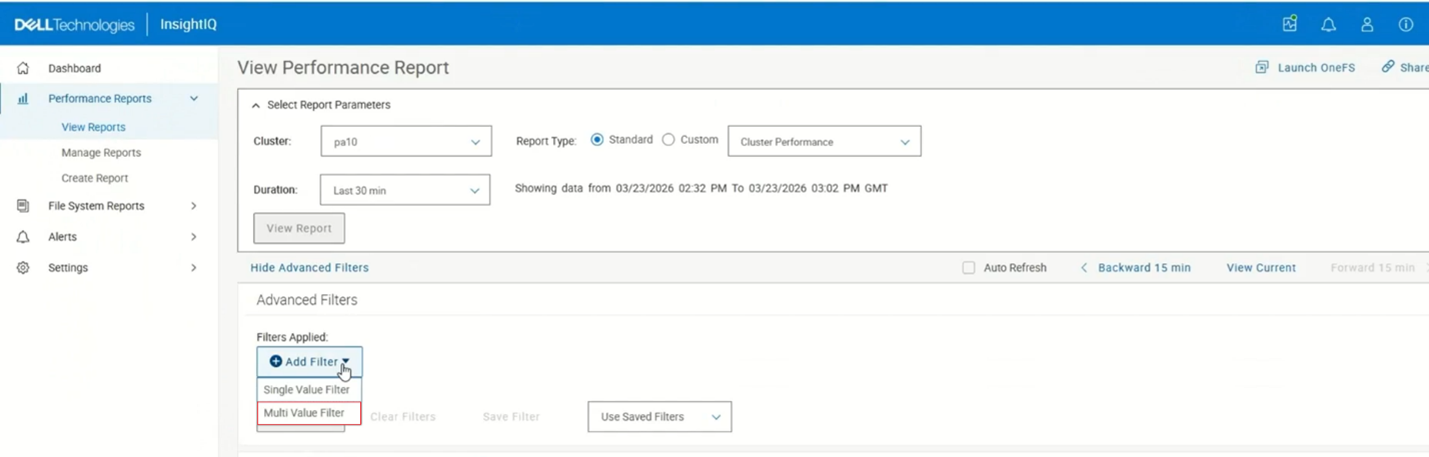
Multi‑value filter selection is supported for the following filter types: protocol, client node, node pool, and tier. For example:
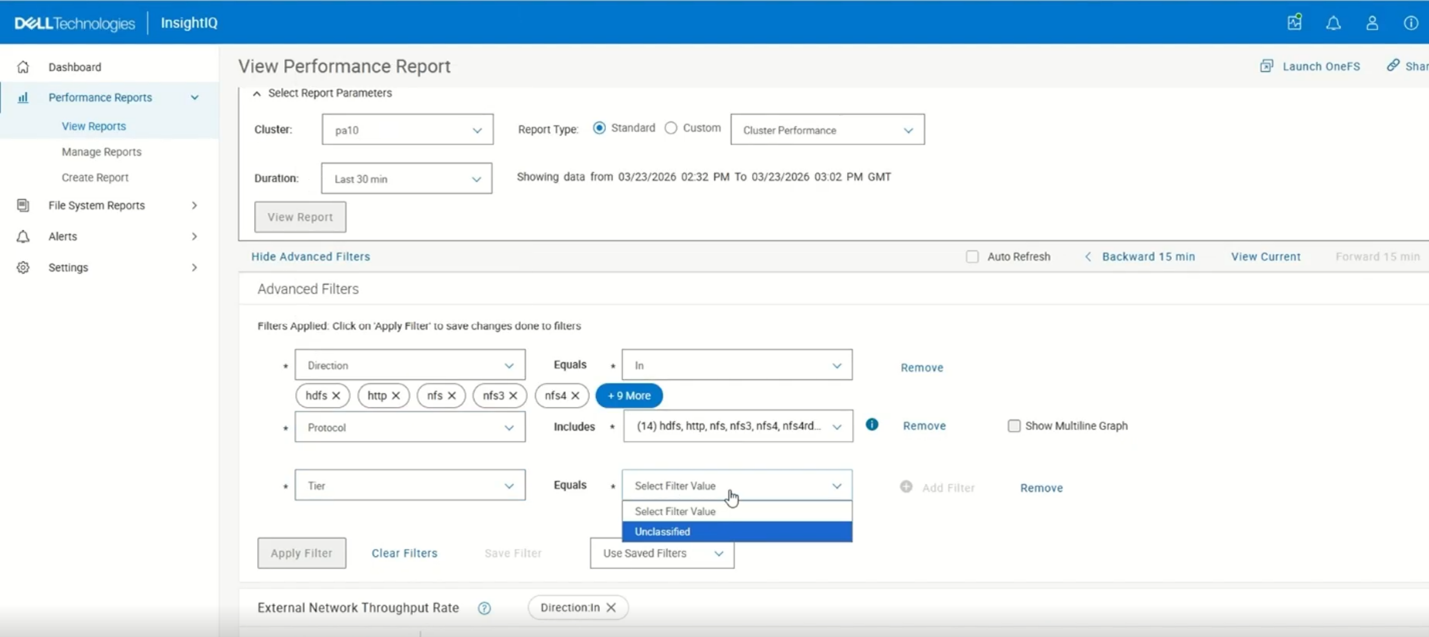
When multi‑value filtering is enabled, the ‘Breakout By’ option is automatically disabled, and the heat map view is hidden. Both features are restored when the user switches back to single‑value filter mode.

In table‑based reports, column‑level filter icons are also hidden while multi‑value filtering is active and reappear when the user reverts to single‑value selection. Download functionality supports both aggregated and multi‑value data, ensuring consistency between the UI and exported results.

When selecting multiple filter values, InsightIQ displays up to five selection ‘pills’, followed by a ‘More’ option. Selecting ‘More’ opens a pop‑up displaying all selected values, where individual entries can be removed using the corresponding remove icon. If more than five values are selected, the ‘Show Multiline Graph’ option becomes unavailable, as this feature supports only two to five filter values. Additionally, InsightIQ enforces a constraint allowing multi‑value selection on only one filter at a time; other filters must remain single‑select.

Once the filter is applied in an aggregated view, the chart presents combined metrics on a single line, with the ‘Breakout By’ option disabled and the heat map hidden.
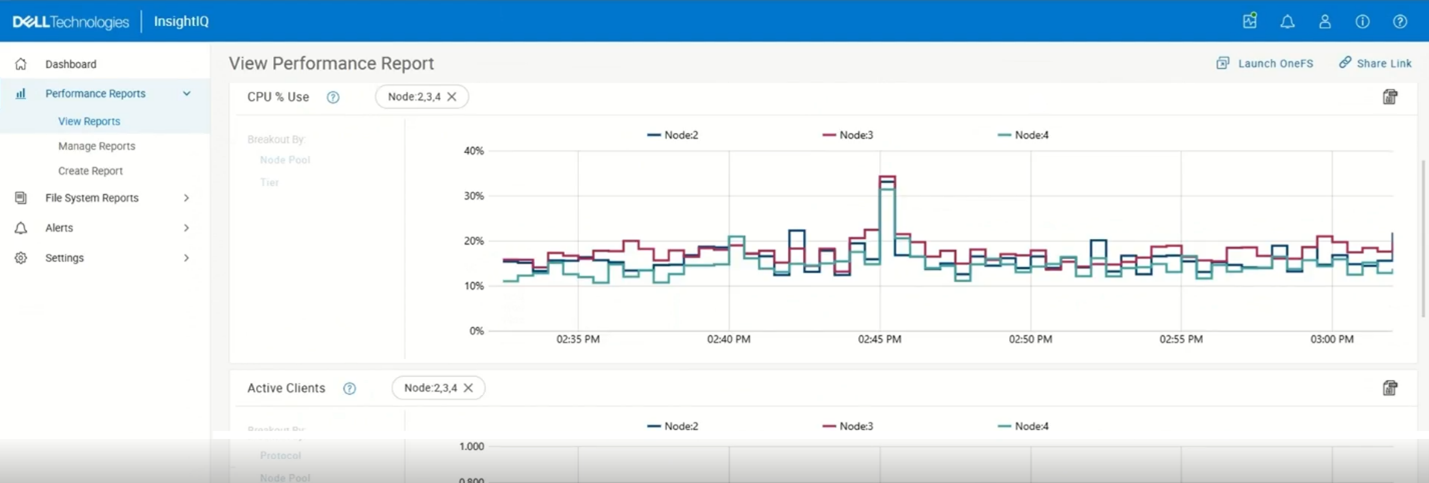
When exporting data from this aggregated view, the resulting CSV includes a column representing the aggregate of the selected filter values, ensuring alignment between the displayed visualization and exported data.

In the multi‑line scenario, users may select between two and five values (eg. multiple nodes) and enable the ‘Show Multiline Graph’ option. The resulting visualization renders a separate line for each selected value. In this mode, while the multi‑line display is preserved in the chart, the ‘Show Multiline Graph’ setting is not retained when saving filters or exporting CSV data. The exported file contains separate columns for each selected filter value, including corresponding minimum and maximum metrics, facilitating side‑by‑side comparison and offline analysis.

When viewing reports that include tabular data, such as the ‘Client Performance’ report, column‑level filter controls for attributes like address, node, and node protocol are hidden while multi‑value filtering is active. These controls are restored once the multi‑value filter is removed, allowing single‑value filtering directly from the table.

In reports where the selected filter is already part of the ‘Breakout By’ configuration (such as ‘Filesystem Cache Performance’) attempting to apply multi‑value filtering results in a notification indicating that the graph does not support this mode. This behavior is expected, as these visualizations already present multi‑line data. However, if multi‑value filtering is applied to a filter that is not used in the breakout configuration, the multi‑line chart remains available, and functions as expected.

In summary, InsightIQ 6.3 preserves the existing behavior for single‑value filtering while introducing multi‑value filtering capabilities that support both aggregated analysis and multi‑line comparisons. These enhancements provide increased analytical flexibility while maintaining consistent behavior across visualizations, reports, and exported data.

Virtual Cluster Support

InsightIQ 6.3 introduces support for monitoring virtual OneFS clusters deployed on public cloud platforms such as AWS and Azure. Historically, InsightIQ monitoring capabilities have been focused on physical PowerScale clusters. However, with the increasing adoption of cloud‑hosted virtual OneFS deployments, extending InsightIQ support to these environments has become essential.

Virtual OneFS clusters differ from physical PowerScale clusters primarily in their licensing model. While PowerScale clusters require feature‑specific licenses—such as SmartQuotas, SmartDedupe, or SmartLock—virtual OneFS clusters rely solely on a OneFS capacity license. This capacity license enables all supported OneFS features without the need for additional feature‑specific licenses.

In a physical PowerScale cluster, licensing information typically reflects multiple dynamically applied, feature‑specific licenses. By contrast, virtual OneFS clusters hosted in AWS or Azure display only the OneFS capacity license, which implicitly covers all supported features. InsightIQ 6.3 now fully understands and accounts for these licensing differences, ensuring accurate license interpretation, proper cluster type detection, and correct enablement of feature‑dependent reporting for cloud‑hosted virtual OneFS clusters.

As a result, InsightIQ now provides expanded monitoring support for customers deploying virtual OneFS clusters in public cloud environments. This enhancement ensures parity in monitoring functionality between on‑premises PowerScale clusters and cloud‑hosted virtual clusters.

Physical OneFS cluster Virtual AWS/Azure based OneFS clusters
•       Feature specific dynamic licensing (SmartQuotas, SmartDedupe etc). •       OneFS Capacity license only

•       No separate feature licenses

To illustrate this capability, consider a comparison of two clusters added to an InsightIQ instance. The first cluster is a standard physical PowerScale deployment. Cluster metadata obtained through CLI commands indicates that it comprises three nodes and is identified as a non‑virtual cluster. Examination of the license information shows multiple feature‑specific licenses, including SmartQuotas, SmartDedupe, and SmartLock. Certain InsightIQ reports—such as quota‑related reports—require a valid feature license to be enabled. In this case, the SmartQuotas license is active, allowing quota reports to be displayed.

The second cluster is a virtual OneFS deployment hosted in the cloud. Cluster metadata identifies it as a virtual cluster consisting of four nodes. License information for this cluster shows only the OneFS capacity license. Despite the absence of individual feature licenses, the capacity license enables full access to all supported OneFS capabilities.

Both clusters can be added to InsightIQ using the same workflow, including credential configuration and cluster registration. Once added, InsightIQ correctly interprets the licensing model for each cluster type. For example, when viewing quota reports, InsightIQ displays the reports for the physical PowerScale cluster based on the presence of a valid SmartQuotas license. When switching to the virtual OneFS cluster, the same quota reports remain available, as the OneFS capacity license inherently enables this functionality.

With this enhancement, InsightIQ 6.3 ensures that reporting behavior remains consistent across physical and virtual deployments, regardless of underlying licensing differences. This capability significantly expands InsightIQ’s monitoring coverage, enabling comprehensive observability for both on‑premises PowerScale clusters and cloud‑hosted virtual OneFS clusters running on AWS or Azure.

SSO Support

InsightIQ 6.3 introduces support for Microsoft Active Directory Federation Services (ADFS) as a new identity provider, enabling Single Sign-On (SSO) for centralized authentication and simplified access management.

In this SSO architecture, InsightIQ functions as a Service Provider (SP) and is provisioned with the required identity claims during deployment. The platform supports full lifecycle management of identity providers, allowing administrators to create, update, delete, and retrieve IdP configurations, upload ADFS federation metadata, perform test connections to validate the integration, and enable or disable the IdP through the access control interface. InsightIQ maintains a consolidated view of all provisioned identity providers along with their operational status. When at least one identity provider is enabled, an SSO login option is automatically displayed on the InsightIQ home page.
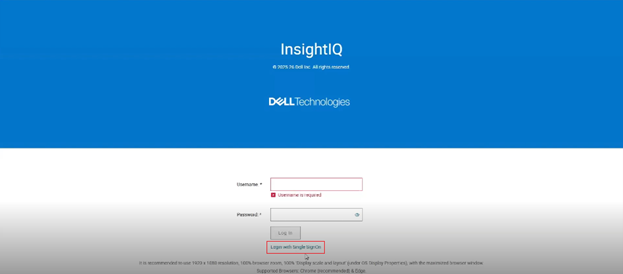
The Launch OneFS workflow has been enhanced to support SSO-based access. When a user authenticates to InsightIQ using SSO and the same SSO configuration is present on the target PowerScale cluster, selecting the ‘Launch OneFS’ option opens the PowerScale dashboard directly without additional authentication prompts.
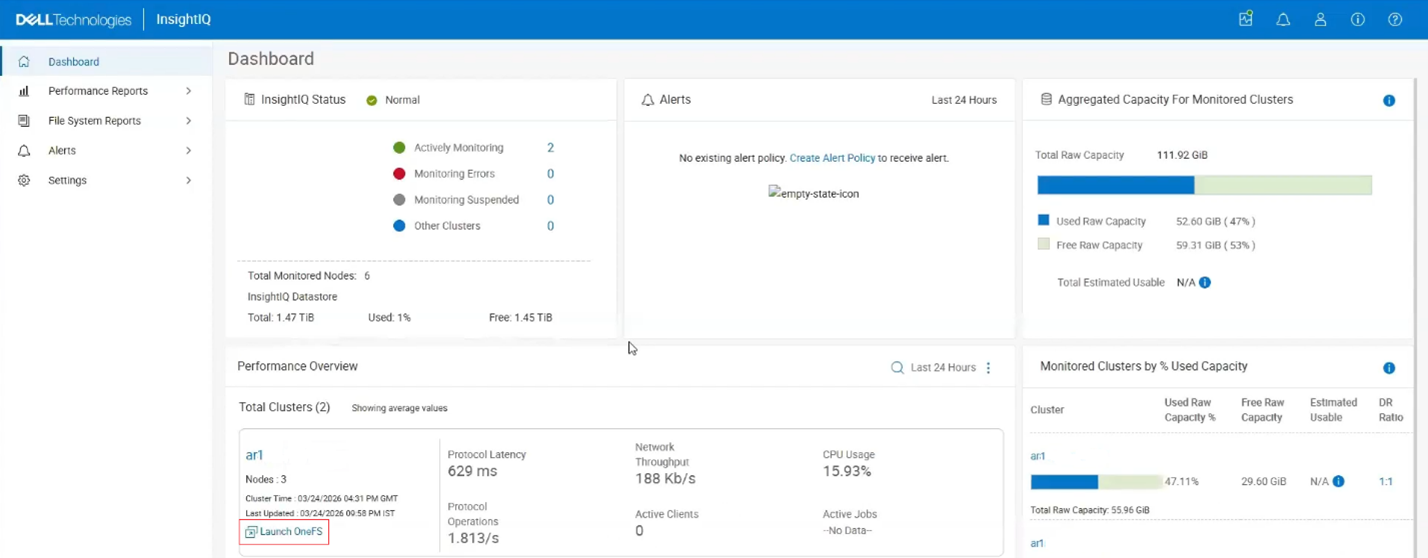
If SSO is not configured on the target cluster, the user is redirected to the PowerScale login page. This behavior change applies only to SSO-based authentication and does not affect existing local, Active Directory, or LDAP login mechanisms.

InsightIQ access control remains group-based and relies on Active Directory group membership. Active Directory administrators are responsible for assigning users from the same or trusted forests to the appropriate groups to grant InsightIQ access. The ADFS administrator must configure the identity provider to integrate correctly with an internal or external LDAP or Active Directory server so that accurate group membership information can be included in authentication claims and passed to InsightIQ for authorization decisions.
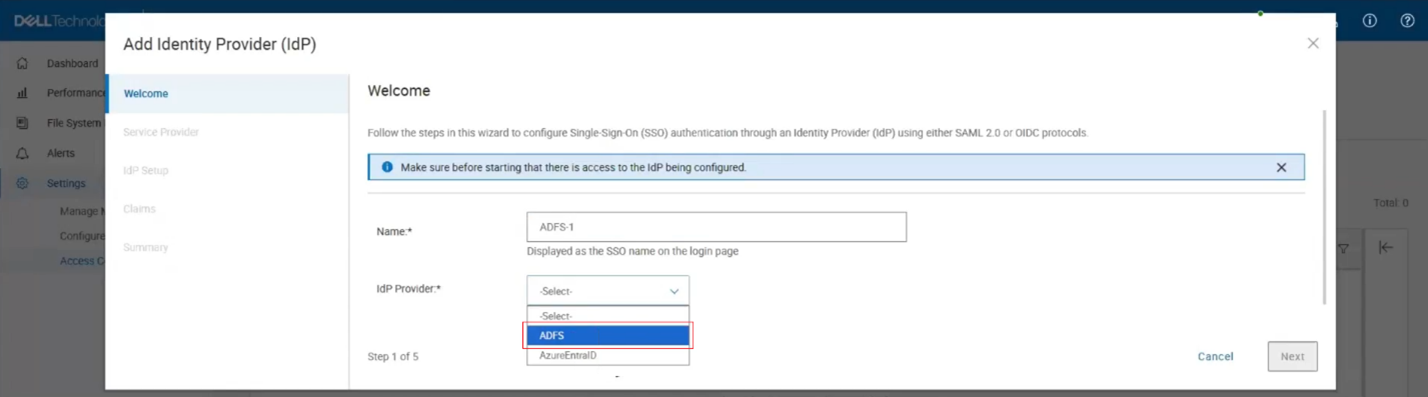
Several prerequisites must be met to enable SSO with ADFS in InsightIQ 6.3. InsightIQ version 6.3 must be installed on a supported Simple or Scale system, and the End User License Agreement must be accepted. An LDAP or Active Directory authentication provider must be configured and enabled in InsightIQ with appropriate group and role mappings defined. Windows Active Directory and DNS infrastructure must be properly configured and operational. Additionally, ADFS must be configured and synchronized with the same LDAP or Active Directory service used by InsightIQ to ensure consistent user and group resolution. Any mismatch in directory configuration between InsightIQ and ADFS can result in SSO authentication failures.

Single Sign-On (SSO) support using Azure EntraID is also added in InsightIQ 6.3 as a new identity provider option, enabling centralized authentication and streamlined access management in PowerScale for Azure Cloud deployments.
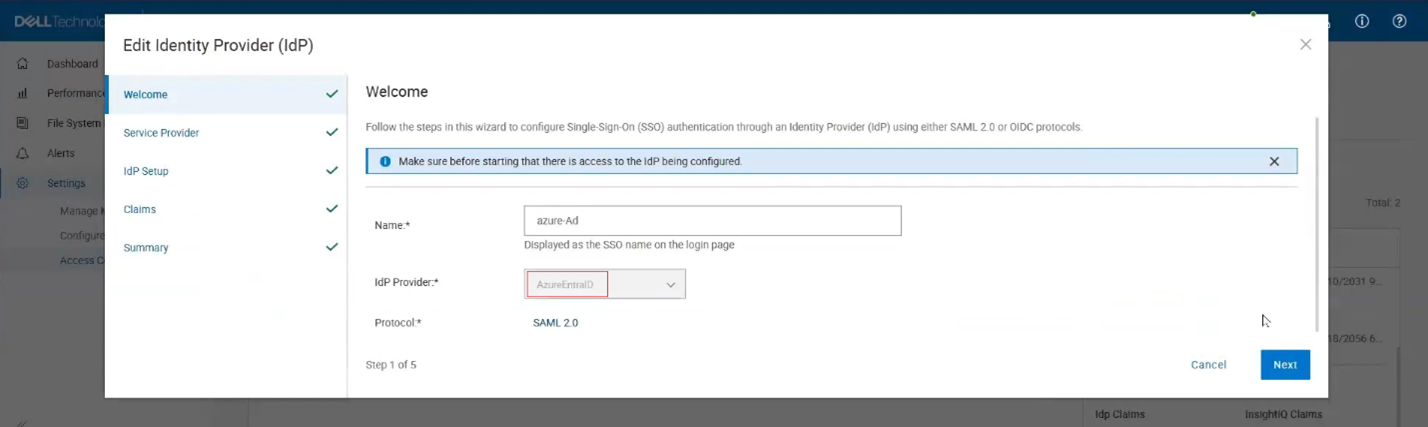
In this configuration, InsightIQ functions as a Service Provider (SP) and is provisioned with the required identity claims during deployment. The platform supports full lifecycle management of identity provider configurations, allowing administrators to create, update, delete, and retrieve IdP definitions, upload Azure EntraID federation metadata, and validate the integration through test connections. Identity providers can be enabled or disabled through the access control interface, and InsightIQ displays all provisioned IdPs along with their current status. When at least one identity provider is enabled, an SSO login option is automatically displayed on the InsightIQ home page. As part of this release, Azure EntraID is available as a newly introduced IdP type during identity provider configuration.

Several prerequisites must be satisfied to enable SSO integration with Azure EntraID. InsightIQ version 6.3 must be installed on a supported Simple or Scale system, and the End User License Agreement must be accepted. An LDAP or Active Directory authentication provider must be configured and enabled in InsightIQ, with appropriate group and role mappings defined. Windows Active Directory and DNS infrastructure must be properly configured and operational. Additionally, Azure EntraID must be configured and synchronized with the same LDAP or Active Directory service that is configured in InsightIQ to ensure accurate user and group synchronization for authentication and authorization.

Partitioned Performance Alignment

InsightIQ has aligned its partition-level performance aggregation logic with PowerScale’s native workload summary calculations. Previously, certain performance graphs in InsightIQ displayed values derived using methods that differed from those used by OneFS CLI tools or the native PowerScale UI, which could result in discrepancies when customers compared InsightIQ metrics with cluster-reported values.

With this update, non-latency metrics, such as IOPS, throughput, CPU reads, and CPU writes, are now computed using the same methodology as OneFS. As a result, InsightIQ metrics closely match those reported directly by the cluster. Latency metrics were already consistent with PowerScale calculations and remain unchanged.

Additionally, a naming update has been introduced in InsightIQ 6.3 to improve clarity. The ‘Workload IOPS’ graph has been renamed to ‘Workload IO Operations’ to more accurately reflect the data represented by the visualization. This change is limited to labeling and does not affect underlying functionality or calculations.

From a support perspective, this enhancement directly addresses previous customer reports regarding inconsistencies between InsightIQ metrics and PowerScale cluster statistics. With the updated aggregation logic, InsightIQ graphs should now closely align with native PowerScale reporting, reducing confusion and improving confidence in performance analysis.

So, in summary, InsightIQ 6.3 offers the following attributes and functionality:

Function Attribute Description
Scope Monitoring scope Up to 20 clusters and 504 nodes
Ecosystem OS support RHEL 8.10, RHEL 9.4, RHEL 10.0, and SLES 15 SP4
Platform Resources Reduced CPUs, memory and disk requirement
    Scale option requires just one node
  Size Smaller package size: OVA package < 5GB
Install and upgrade Installation Installation time:  < 12 mins
  Migration Direct migration from 4.x
    Online migration from InsightIQ 6.3 Simple (OVA) to InsightIQ 6.3 Scale
Resilience Data collection Resilient data collection – no data loss
OS Support Simple ecosystem support InsightIQ Simple 6.3 can be deployed on the following platforms:

·         VMware virtual machine running ESXi version 8.0U3 or 9.0.1.

·         VMware Workstation 17 (free version) InsightIQ Simple 6.3 can monitor PowerScale clusters running OneFS versions 9.7 through 9.14.

·         OpenStack RHOSP 21 with RHEL 9.6

  Scale ecosystem support InsightIQ Scale 6.3 can be deployed on Red Hat Enterprise Linux versions 8.10 or 9.4 (English language versions) and SUSE Enterprise Linux (SLES) 15 SP4. InsightIQ Scale 6.3 can monitor PowerScale clusters running OneFS versions 9.7 through 9.14.
Upgrade In-place upgrade from InsightIQ 5.1.x to 6.x The upgrade script supports in-place upgrades from InsightIQ 5.1.x to 6.x.
Reporting Maximum and minimum ranges on all reports All live Performance Reports display a light blue zone that indicates the range of values for a metric within the sample length. The light blue zone is shown regardless of whether any filter is applied. With this enhancement, users can observe trends in values on filtered graphs.
  Graphing and report visualization Reports are designed to maximize the number of graphs that can appear on each page.

·         Excess white space is eliminated.

·         The report parameters section collapses when the report is run. The user can expand it manually.

·         Graph heights are decreased when possible.

·         Page scrolling occurs while the collapsed parameters section remains fixed at the top.

User interface What’s New dialog All InsightIQ users can view a brief introduction to new functionality in the latest release of InsightIQ. Access the dialog from the banner area of the InsightIQ web application. Click About > What’s New.
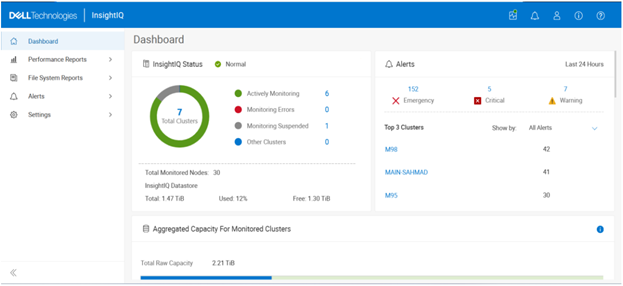
  Compact cluster performance view on the Dashboard The IIQ dashboard provides:

·         Summary information for six clusters appears in the initial dashboard view. A sectional scrollbar controls the view for additional clusters.

·         The capacity section has its own scrollbar.

·         The navigation side bar is collapsible into space-saving icons. Use the << icon at the bottom of the side bar to collapse it.

PowerScale InsightIQ 6.3 Features

In this second article in the InsightIQ 6.3 series, we’ll dig into the details of the additional functionality that debuts in this new IIQ release.

When upgrading to the new InsightIQ 6.3 release, the process is largely consistent with previous upgrades, such as InsightIQ 6.2.

The specific deployment options and hardware requirements for installing and running InsightIQ 6.x are as follows:

Attribute InsightIQ 6.3 Simple InsightIQ 6.3 Scale
Scalability Up to 10 clusters or 252 nodes Up to 20 clusters or 504 nodes
Deployment On VMware, using OVA template RHEL, SLES, or Ubuntu with deployment script
Hardware requirements VMware v15 or higher:

·         CPU: 8 vCPU

·         Memory: 16GB

·         Storage: 1.5TB (thin provisioned);

Or 500GB on NFS server datastore

Up to 10 clusters and 252 nodes:

·         CPU: 8 vCPU or Cores

·         Memory: 16GB

·         Storage: 500GB

Up to 20 clusters and 504 nodes:

·         CPU: 12 vCPU or Cores

·         Memory: 32GB

·         Storage: 1TB

Networking requirements 1 static IP on the PowerScale cluster’s subnet 1 static IP on the PowerScale cluster’s subnet

To initiate the upgrade to 6.3, the system must be running an InsightIQ 6.1 or 6.2 Scale or Simple deployment, plus a minimum of 40 GB of available disk space is required.

Once these prerequisites are satisfied, the upgrade process begins by extracting the InsightIQ 6.3 installer package, followed by extraction of the upgrade bundle. The upgrade is then initiated by executing the ‘upgrade-iiq.sh’ script.

Upgrade progress can be monitored using the appropriate status commands to view upgrade locks and overall status. For more detailed information, including lock details and intermediate steps, administrators can review the InsightIQ_upgrade.log file.

The InsightIQ upgrade workflow consists of five distinct stages:

During the pre-check stage, the installer verifies the availability of required Docker commands, validates the existing InsightIQ version, checks for sufficient disk space, confirms that all InsightIQ services are running, and ensures operating system compatibility.

In the pre-upgrade stage, the installer verifies acceptance of the EULA and extracts the required InsightIQ images. The currently running InsightIQ services are then stopped, necessary directories are created, and optional containers are updated as needed.

The upgrade stage includes updating resource limits, upgrading add-on services, installing the CIM component, and upgrading the remaining InsightIQ services. The EULA is updated, followed by a final health check to confirm that all InsightIQ services are running correctly.

During the post-upgrade stage, additional steps are performed depending on the source version. For systems upgrading from InsightIQ 6.1, the Docker network is upgraded, and InsightIQ metadata is then updated.

Finally, the cleanup stage replaces outdated scripts, removes obsolete Docker images, and deletes temporary upgrade and backup directories to complete the upgrade process.

Phase Details
Pre-check •       Docker command

•        InsightIQ version check 6.1.0 or 6.2.0

•       Free disk space

•       InsightIQ services status

•       OS compatibility

Pre-upgrade •       EULA accepted

•       Extract the IIQ images

•       Stop IIQ

•       Create necessary directories

•       Update optional containers

Upgrade •       Update resource limit

•       Upgrade addons services

•       Upgrade IIQ services

•       Upgrade EULA

•       Status Check

Post-upgrade •       Update network (if 6.1.0)

•       Update IIQ metadata

Cleanup •       Replace scripts

•       Remove old docker images

•       Remove upgrade and backup folders

Specific steps in the upgrade process are as follows:

  • Download and uncompress the bundle:
# tar xvf iiq-install-6.3.0.tar.gz
  • From within the InsightIQ directory, un-tar the upgrade scripts as follows:
# cd InsightIQ

# tar xvf upgrade.tar.gz
  • Enter the resulting ‘upgrade’ directory which contains the scripts:
# cd upgrade/
  • Initiate the IIQ upgrade. Note that the usage is same for both the Simple and Scale InsightIQ deployments.
# ./upgrade-iiq.sh -m <admin_email>

Upon successful upgrade completion, InsightIQ will be accessible via the primary node’s IP address.

Quick and easy upgrade progress checks include:

Check Command syntax
Check the latest 100 lines of upgrade log showupg –l or showupg –log
Check the latest 100 lines of upgrade status showupg –s or showupg –status
Check detailed logs cat /usr/share/storagemonitoring/logs/upgrade/log/insightiq_upgrade.log

AI-based Assistant

InsightIQ 6.3 introduces a new AI‑based Assistant. This intelligent, document‑aware AI companion is designed to help users quickly find answers, understand product capabilities, and troubleshoot issues related to InsightIQ and PowerScale. The assistant draws its responses from supported documentation, including InsightIQ and PowerScale documentation, release notes, and knowledge base articles.

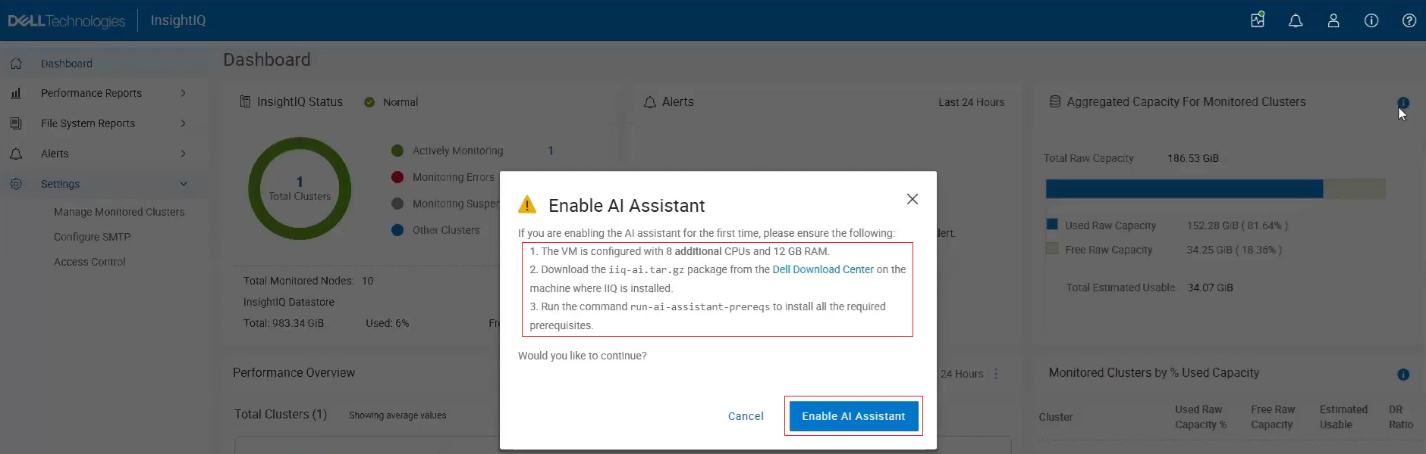
To enable the AI Assistant, several prerequisites must be met. An AI-enabled InsightIQ deployment requires an additional 8 vCPUs or cores and 12 GB of RAM above the general IIQ 6.3 spec, and a separate AI Assistant package must also be installed, which is available in the Download Center and is distinct from the standard InsightIQ Scale and Simple packages.

Note that this feature is not available in the Greater China region due to legal and regulatory restrictions, as it relies on AI models that are not permitted in that geography. Consequently, the option to enable the AI Assistant will not appear if the system is configured for the China region.

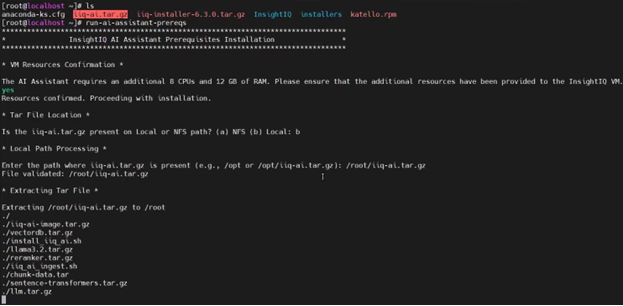
To activate the AI Assistant, users must first download the AI Assistant tar package (iiq-ai.tar.gz) from the Download Center and run the AI Assistant prerequisite command to install all required dependencies.

Note that the IIQ server resources must be updated to include the additional CPU and memory requirements as described above, after which the AI Assistant option can be enabled.

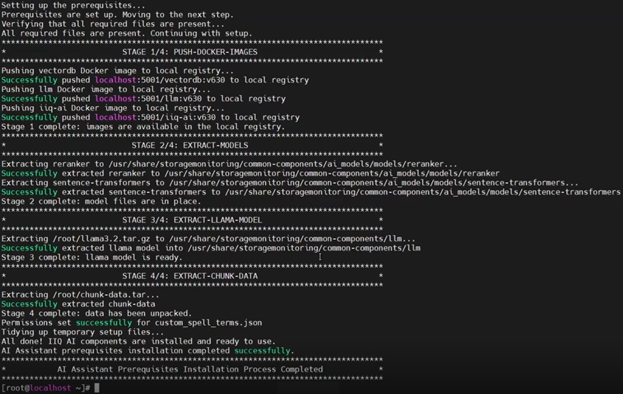
The AI assistance prerequisite installation script ‘run-ai-assistant-prereqs’ comprises four main stages:

Stage Description Location
1 Push docker images ·         Local registry
2 Extract models ·         /usr/share/storagemonitoring/common-components/ai_models/models/reranker

·         /usr/share/storagemonitoring/common-components/ai_models/models/sentence-transformer

3 Extract Llama model ·         /usr/share/storagemonitoring/common-components/llm
4 Extract chunk data ·         /usr/share/storagemonitoring/common-components/custom_spell_terms.json

For example:

IIQ validates that all prerequisites are satisfied before launching the required containers and their respective services, including the Large Language Model (LLM), the vector database, and the InsightIQ AI Assistant controller. Once these services are running, the chatbot becomes available for use.

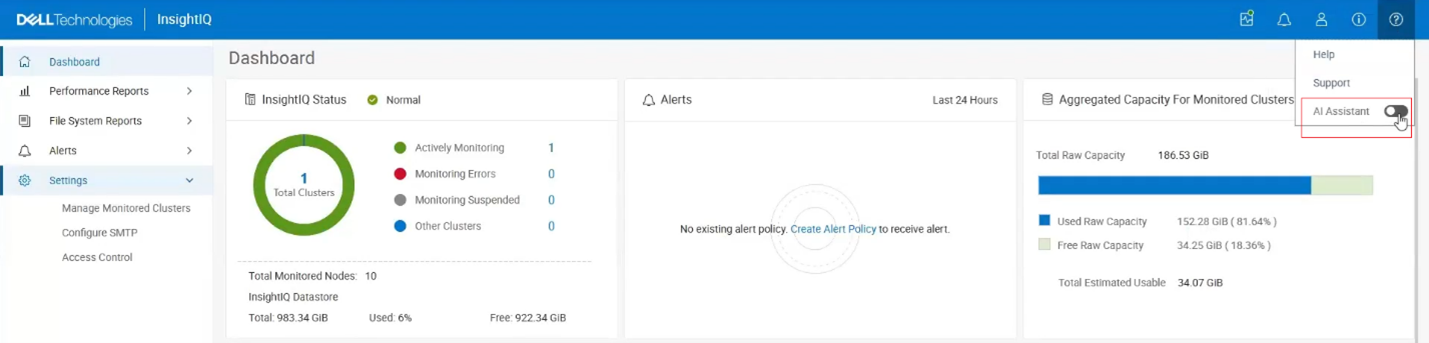
Next, the AI Assistant can be enabled from the InsightIQ masthead as follows:

The following popup window is displayed, reiterating the prerequisites and prompting to ‘Enable AI Assistant’:

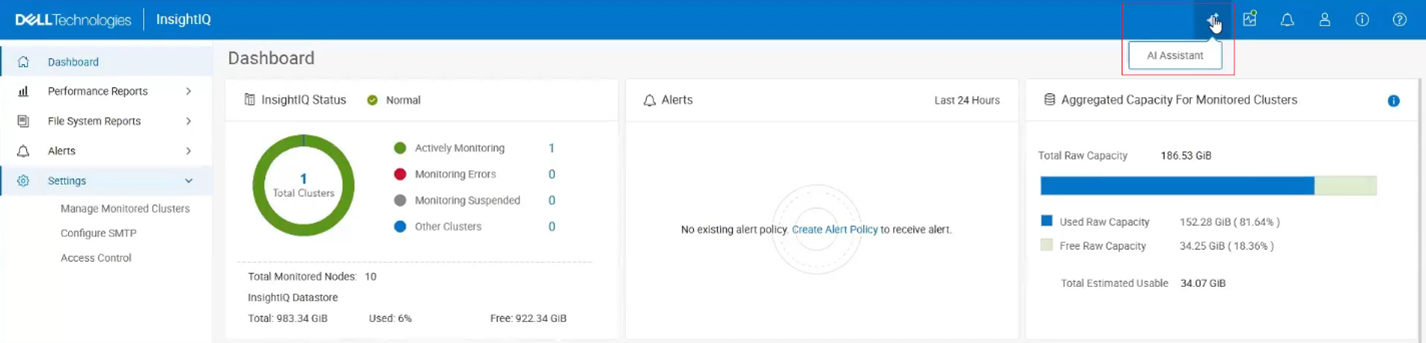
At this point, assuming the prerequisites have been met, an AI Assistant button is added to the UI masthead:

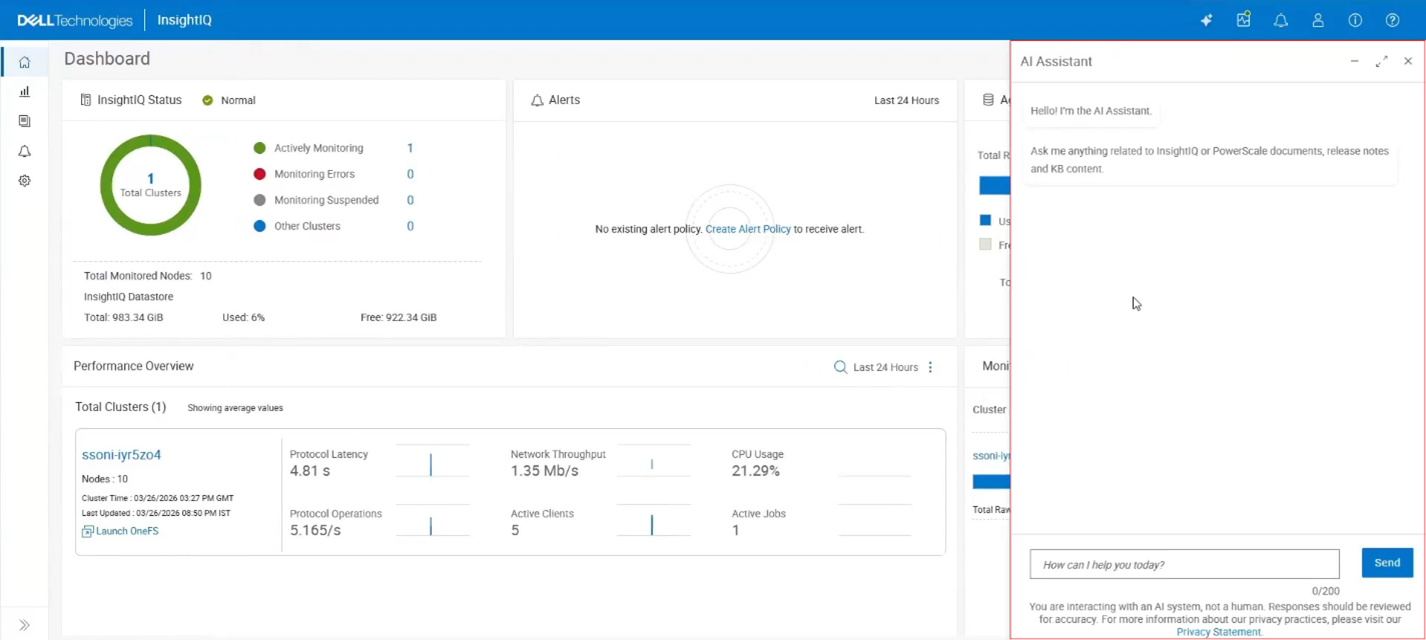
Clicking this button opens the AI Assistant chat window with a ‘How can I help you today?’ prompt:

A warning is displayed noting “You are interacting with an AI system, not a human. Responses should be reviewed for accuracy.” A link is provided for more information on Dell’s Privacy Statement too.

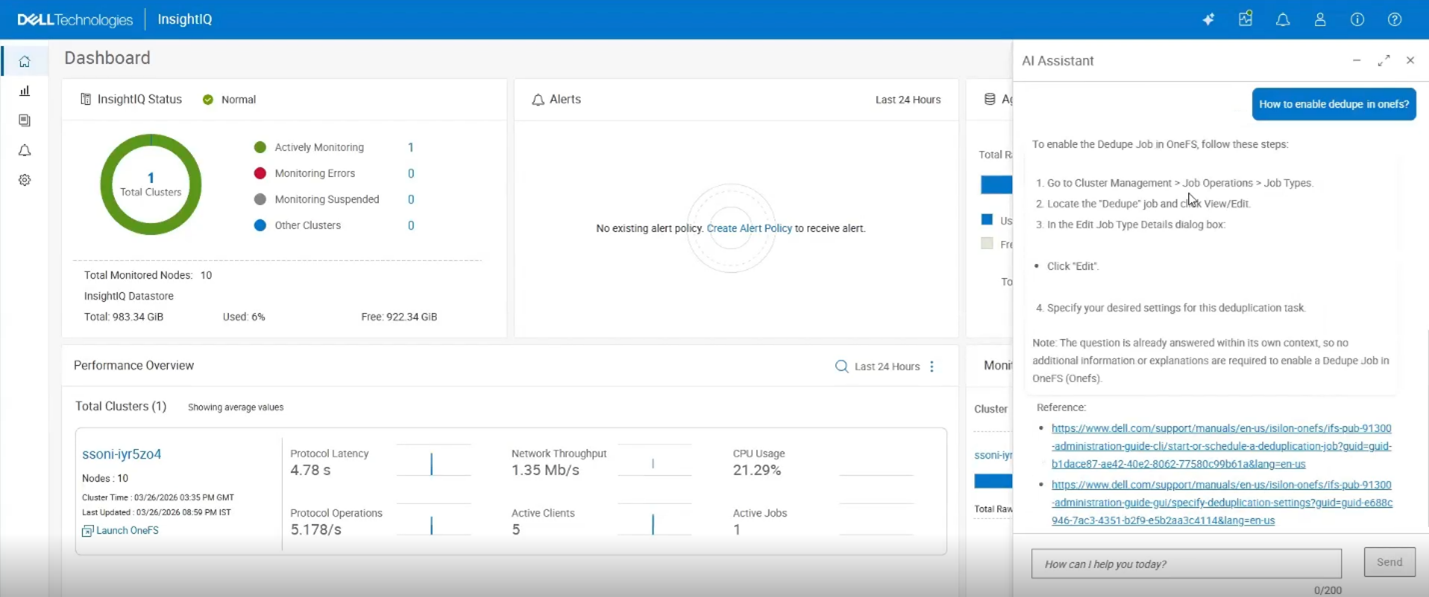
At this point, natural language questions can be entered into the text box. For example, “how to enable dedupe in OneFS?”:

Upon clicking ‘Send’, the AI system parses the instruction and provides its best response, in this case by providing a four-step procedure for enabling OneFS deduplication, plus supporting documentation references and links.

In the next article in the InsightIQ 6.3 series, we’ll focus on the additional functionality that debuts in this new IIQ release, including:

  • Support for monitoring virtual clusters deployed on AWS or Azure.
  • Increased performance visibility for file and object workloads.
  • Enhanced filtering capabilities with multiple values per category.
  • Single Sign-On (SSO) support via Microsoft ADFS or Azure Entra ID.
  • Direct, in-place upgrades from versions 6.1 and 6.2.

PowerScale InsightIQ 6.3

It’s been a sprightly spring for Dell PowerScale. Hot on the heels of the OneFS 9.14 launch comes the introduction of the innovative new PowerScale InsightIQ 6.3 release.

InsightIQ provides powerful performance and health monitoring and reporting functionality, helping to maximize PowerScale cluster efficiency. This includes advanced analytics to optimize applications, correlate cluster events, and the ability to accurately forecast future storage needs.

So what new functionality does this InsightIQ 6.3 release add to the PowerScale metrics and monitoring mix?

Additional functionality includes:

Feature IIQ 6.3 Functionality
Expanded Ecosystem ·         Ecosystem support extended to include RHEL 10.0 and PowerScale OneFS 9.14.
Virtual Cluster Support ·         Monitoring of virtual clusters on AWS or Azure to also use InsightIQ no matter where InsightIQ is located.
Support Granular Protocol Operations ·         Break down performance metrics by S3 operations, helping analyze and troubleshoot S3 protocol issues.
Multiple values per category filtering ·         Filter on multiple IP, host, node and protocol, enabling administrators comparing performance by variety of individuals against the same period.
SSO support ·         IIQ users can enable SSO via Azure AD or ADFS. SAML only
Upgrade ·         In-place, direct upgrade from 6.1 and 6.2 to 6.3

The new PowerScale InsightIQ 6.3 release introduces several significant enhancements aimed at improving flexibility, security, and usability. IIQ 6.3 expands platform compatibility by extending ecosystem support to Red Hat Enterprise Linux (RHEL) 10.0 and PowerScale OneFS 9.14.

InsightIQ 6.3 also adds support for monitoring virtual clusters deployed on AWS or Azure, allowing InsightIQ to monitor environments regardless of where the application itself is hosted. Performance visibility for file and object workloads has been enhanced through support for granular protocol operations, enabling metrics to be analyzed and broken down by individual file and/or object actions to streamline troubleshooting of protocol-related issues. Filtering capabilities have been improved to allow multiple values per category—such as IP addresses, hosts, nodes, and protocols—making it easier to compare performance across multiple entities within the same time range.

Security and operational integration are further strengthened with Single Sign-On support using SAML-based authentication through Microsoft ADFS or Azure Entra ID. InsightIQ 6.3 also supports direct, in-place upgrades from versions 6.1 and 6.2, simplifying the upgrade process for existing Scale and Simple deployments.

InsightIQ 6.3 introduces a new AI‑based assistant, too. This AI assistant is an intelligent, document‑aware companion designed to help users quickly find answers, understand product capabilities, and troubleshoot issues related to InsightIQ and PowerScale. The assistant draws its responses from supported documentation, including InsightIQ and PowerScale documentation, release notes, and knowledge base (KB) articles.

InsightIQ 6.3 continues to offer the same two deployment models as its predecessors:

Deployment Model Description
InsightIQ Scale Resides on bare-metal Linux hardware or virtual machine.
InsightIQ Simple Deploys on a VMware hypervisor (OVA).

The InsightIQ Scale version resides on bare-metal Linux hardware or virtual machine, whereas InsightIQ Simple deploys via OVA on a VMware hypervisor.

InsightIQ v6.x Scale enjoys a substantial breadth-of-monitoring scope, with the ability to encompass 504 nodes across up to 20 clusters.

Additionally, InsightIQ v6.x Scale can be deployed on a single Linux host. This is in stark contrast to InsightIQ 5’s requirements for a three Linux node minimum installation platform.

Deployment:

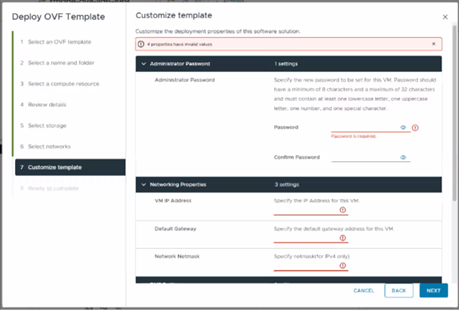
The specific deployment options and hardware requirements for installing and running InsightIQ 6.x are as follows:

Attribute InsightIQ 6.3 Simple InsightIQ 6.3 Scale
Scalability Up to 10 clusters or 252 nodes Up to 20 clusters or 504 nodes
Deployment On VMware, using OVA template RHEL, SLES, or Ubuntu with deployment script
Hardware requirements VMware v15 or higher:

·         CPU: 8 vCPU

·         Memory: 16GB

·         Storage: 1.5TB (thin provisioned);

Or 500GB on NFS server datastore

Up to 10 clusters and 252 nodes:

·         CPU: 8 vCPU or Cores

·         Memory: 16GB

·         Storage: 500GB

Up to 20 clusters and 504 nodes:

·         CPU: 12 vCPU or Cores

·         Memory: 32GB

·         Storage: 1TB

Networking requirements 1 static IP on the PowerScale cluster’s subnet 1 static IP on the PowerScale cluster’s subnet

Ecosystem support:

The InsightIQ ecosystem includes VMware ESXi v9.0.1 in addition to VMware v8 OU3, Ubuntu 24.04 Online deployment and OpenStack RHOSP 21 with RHEL 9.6, SLES 15 SP4, and Red Hat Enterprise Linux (RHEL) versions 9.6 and 8.10. This allows customers who have standardized upon VMware to run an InsightIQ 6.3 Scale deployment image on an ESXi 9.0.1 hypervisor to monitor the latest OneFS versions.

Qualified on InsightIQ 6.2 InsightIQ 6.3
OS (IIQ Scale) RHEL 8.10, RHEL 9.6, and SLES 15 SP4 RHEL 8.10, RHEL 9.6, RHEL 10.0, SLES 15 SP4
PowerScale OneFS 9.5 to 9.13 OneFS 9.7 to 9.14
VMware ESXi ESXi v8.0U3, and ESXi v9.0.1 ESXi v8.0U3, and ESXi v9.0.1
VMware Workstation Workstation 17 Free Version Workstation 17 Free Version
Ubuntu Ubuntu 24.04 Online deployment Ubuntu 24.04 Online deployment
OpenStack RHOSP 21 with RHEL 9.6 RHOSP 21 with RHEL 9.6

Similarly, in addition to deployment on VMware ESXi 8 and 9, the InsightIQ Simple version can also be installed for free on VMware Workstation 17, providing the ability to stand up InsightIQ in a non-production or lab environment for trial or demo purposes, without incurring a VMware licensing charge.

Additionally, the InsightIQ OVA template is under 5GB in size, and with an installation time of generally less than 12 minutes.

In the next article in this series, we’ll dig into the details of the additional functionality that debuts in this new InsightIQ 6.3 release.

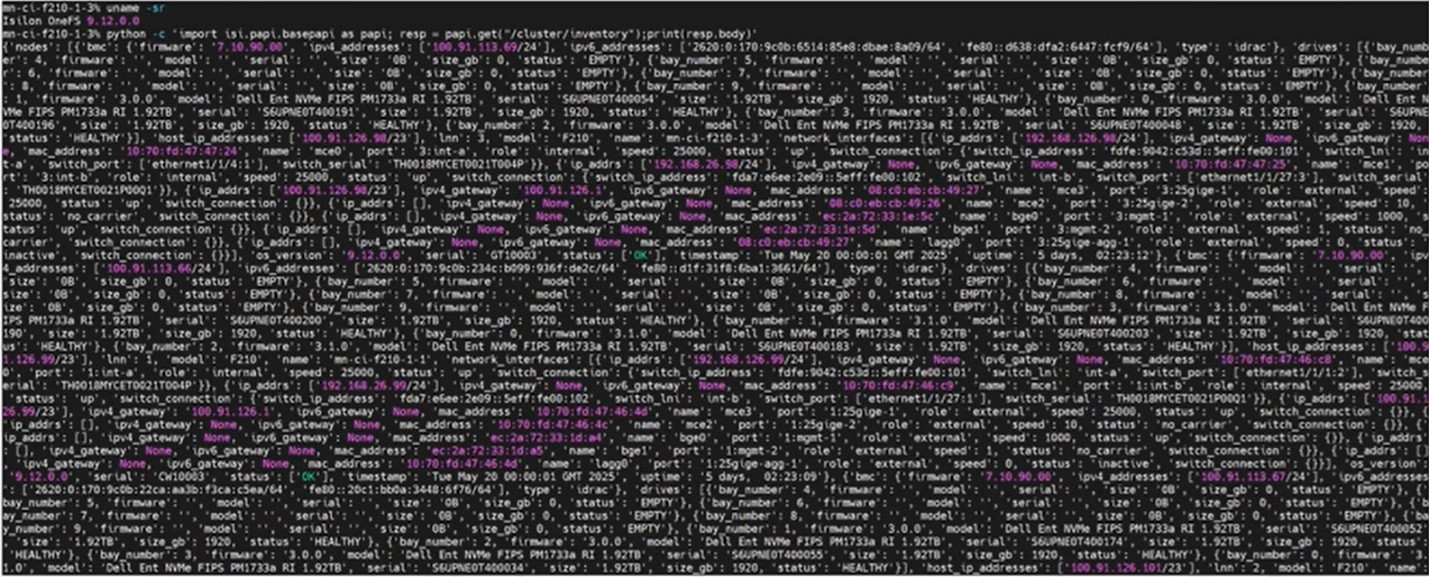
OneFS Cluster Inventory Request API

The OneFS cluster inventory request API  enables automated workflows to query detailed hardware and infrastructure inventory information from a PowerScale cluster. This capability, which was introduced in OneFS 9.12, is particularly useful for orchestration and discovery use cases, functioning in a manner similar to how LLDP is used within networking environments to collect device and topology data.

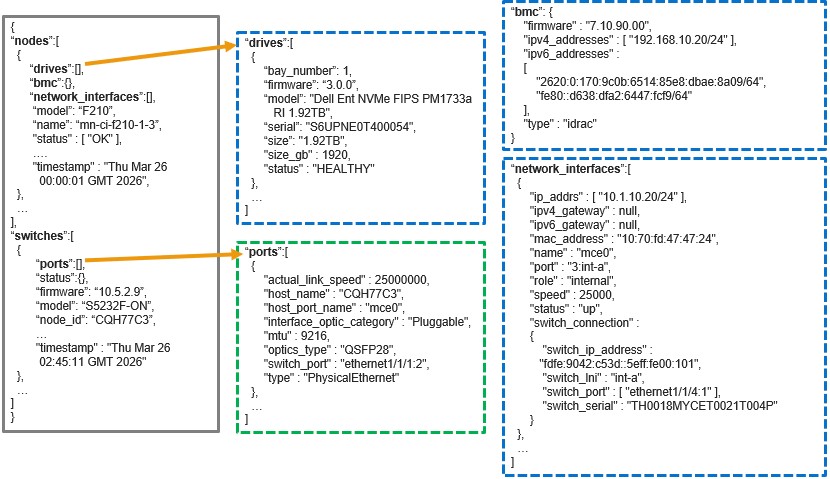
The new REST API provides comprehensive inventory details at both the node and backend fabric levels. Node‑level inventory includes general system information, baseboard management controller (BMC) data, network interface details, and attached storage drives. In addition, the response includes backend switch inventory information for supported Ethernet switches running firmware versions later than 10.5.2. InfiniBand switches are not currently supported by this feature. The API also returns the last known inventory state for any component that is offline at the time of the request, such as during upgrades or maintenance, allowing visibility into previously collected data even when a component is temporarily unavailable.

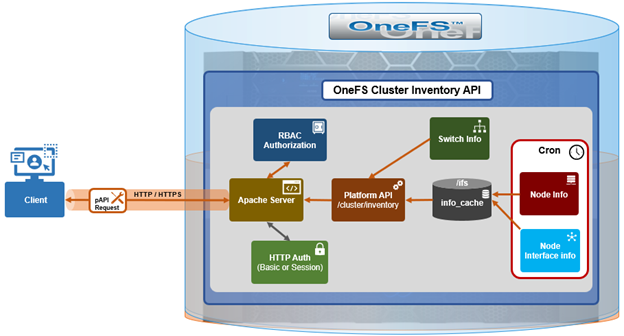
The inventory collection mechanism uses a producer‑consumer design model. On the producer side, cron jobs periodically query cached node and switch information and store the results as inventory cache files within the /ifs filesystem. For node‑level inventory, OneFS collects system and hardware details and saves them to the node information cache. For backend switches, inventory data is retrieved from the switch information cache. The cluster inventory request API also leverages the existing OneFS FlexNet service and its data store to collect network interface details such as IP addressing and interface configuration.

On the consumer side, a new platform API handler reads these cached inventory files from /ifs and assembles them into a consolidated inventory report, which is then returned to the requesting client. This design avoids real‑time polling of hardware during API requests, improving both performance and reliability.

Here are some details regarding the new cron jobs and event triggers:

Inventory Update Method Storage Location Frequency
Node cache inventory update Cron scheduled Node info cache /ifs/.ifsvar/db/node_info_cache/* Every 12 hours
Backend switch inventory update Cron scheduled Switch info cache /ifs/.ifsvar/db/switch_info_cache/* Every 15 minutes
Event-driven node-level update Event triggered Node info cache /ifs/.ifsvar/db/node_info_cache/* Update on /ifs mount events
Node networking update Event triggered Flexnet DB /ifs/.ifsvar/module/flexnet/* IP network change events

Several periodic and event‑driven mechanisms are used to keep the inventory data current. A scheduled cron job updates the node‑level inventory cache every twelve hours, while a separate cron job refreshes the backend switch inventory cache every fifteen minutes. For example:

# cat /etc/crontab | grep inventory

# run the gather inventory switches info every 15 minutes

*/15    *       *       *       *       root    isi_ropc /usr/bin/isi_gather_inventory -t switches

# run the gather inventory node cache info every 12 hours

0       */12    *       *       *       root    /usr/bin/isi_gather_inventory -t node

In addition to these scheduled updates, OneFS uses event‑driven triggers to refresh inventory data when relevant system changes occur. For example, when the /ifs filesystem is mounted, OneFS automatically triggers a node‑level inventory update to ensure the latest data is captured. Network‑related inventory data is updated in response to IP configuration changes via the FlexNet database.

The inventory cache data is stored in three locations within /ifs, consisting of the node inventory cache, the switch inventory cache, and the FlexNet database for network interface information. Customers access the inventory data through a single REST API endpoint provided by the OneFS platform API at /platform/<version>/cluster/inventory:

http://<x.x.x.x>:8080/platform/26/cluster/inventory

Or with python:

# python -c 'import isi.papi.basepapi as papi; resp = papi.get("/cluster/inventory");print(resp.body)'

Note that access to this inventory endpoint requires the requesting user to possess both the ‘ISI_PRIV_DEVICES’ and ‘ISI_PRIV_NETWORK’ RBAC privileges.

Here’s an example of this substantial inventory report from an F210 cluster:

When queried, the API returns a structured inventory report comprising two primary sections: a

  • Nodes array
  • Switches array

For example:

Specifically, each ‘nodes’ object represents an individual node in the cluster and includes nested objects for its drives, BMC details, and network interfaces. The ‘switches’ array represents the entire backend fabric, and may include multiple backend switches, with each switch object containing its corresponding port‑level information.

If a backend switch query fails, the behavior depends on whether valid inventory data was previously collected. If historical data exists, the API returns the last known switch inventory state. If the backend switch has never been successfully queried, the switches section of the response will be empty. This behavior ensures that the inventory report remains consistent and informative even when transient connectivity issues occur.

The PowerScale OneFS cluster inventory request API (`isi.papi.basepapi`) allows native Python integration for cluster inventory operations, offering more robust error handling and authentication management compared to direct HTTP requests. This native API approach is particularly well-suited for DevOps automation workflows, enabling seamless integration with configuration management tools, CI/CD pipelines, and infrastructure-as-code frameworks.

The fundamental approach to accessing cluster inventory through the OneFS cluster inventory request API involves importing the `isi.papi.basepapi` module and using the `get()` method to retrieve inventory data. This method provides automatic session management, authentication handling, and response parsing, simplifying the development of automation scripts. For example, here’s a basic python script to perform a node and drive inventory on a cluster:

#!/usr/bin/env python3

import isi.papi.basepapi as papi

try:

    resp = papi.get("/cluster/inventory")

    if resp.status == 200:

        inventory = resp.body

        nodes = inventory.get("nodes", [])

        drive_count = sum(len(node.get("drives", [])) for node in nodes)

        print(f"Cluster contains {len(nodes)} nodes")

        print(f"Total drives: {drive_count}")

    else:

        print(f"Error: {resp.status} - {resp.body}")

except Exception as e:

    print(f"API Error: {e}")

The script’s output is along the following lines:

# python3 inventory.py

Cluster contains 228 nodes

Total drives: 4342

From a troubleshooting perspective, OneFS also includes an internal ‘isi_gather_inventory’ command line (CLI) utility that can be used to manually initiate inventory collection.

Component Details
Node information isi_gather_inventory -t node
Switch information isi_gather_inventory -t switches
Log file /var/log/messages

Note that the ‘isi_gather_inventory’ CLI tool can only be run by root.

Separate commands are available to gather node inventory data or backend switch information, and related messages are written to the system log. The utility does not generate standalone log files, but inventory cache contents can be collected using standard OneFS support log packages, which include archived copies of the node and switch inventory cache data.

PowerScale inventory monitoring can be readily integrated into modern DevOps and infrastructure automation workflows. Within CI/CD pipelines—such as those implemented in Jenkins—the OneFS cluster inventory API enables automated pre-deployment validation, ensuring cluster health and configuration integrity before changes are applied. This approach supports continuous change detection and compliance verification as part of the delivery lifecycle.

Configuration management tools such as Ansible can leverage the cluster inventory API for dynamic inventory generation and real-time state validation. By querying current cluster conditions during playbook execution, automation workflows can enforce guardrails that ensure configuration changes occur only when predefined operational criteria are met. Similarly, Terraform can consume inventory data via external data sources, enabling adaptive infrastructure-as-code patterns that align deployments with the actual cluster state and reduce configuration drift.

GitOps workflows further benefit from PowerScale inventory integration by embedding automated validation checks into controllers and operators. Infrastructure changes are applied only when cluster conditions are healthy and compliant, providing a reliable mechanism for policy-driven storage management at scale.

Beyond deployment orchestration, the cluster inventory API supports a wide range of operational use cases. Capacity planning automation can be achieved through periodic collection of node and drive inventory data, combined with trend analysis to forecast growth and trigger proactive alerts as utilization thresholds are approached. Performance monitoring systems, such as Prometheus, can ingest inventory and performance metrics to provide end-to-end observability, enabling threshold-based alerting and long-term performance optimization.

Maintenance workflows can also be automated using the API’s health and hardware inventory data to detect failing components and initiate remediation processes. Integration with IT service management and procurement systems enables automated ticket creation and replacement part ordering, while detailed hardware metadata ensures compatibility and accuracy. Finally, regular synchronization with configuration management databases (CMDBs) ensures inventory accuracy, supporting change management, auditability, and compliance reporting across the storage environment.

OneFS User Account Lockout for File Provider Configuration and Management

In this second article in the series we turn our focus to the configuration and management of the user account lockout functionality.

As discussed in the previous article, OneFS 9.13 adds three new account lockout configuration settings for the file provider. The ‘lockout-threshold’ parameter defines the maximum number of failed authentication attempts allowed before an account is locked. The ‘lockout-window’ specifies the time period over which those failed attempts are counted; if the threshold is not reached within this window, the failure counter automatically resets. Lastly, ‘lockout-duration’ determines how long the account remains locked after the threshold has been exceeded.

In operation, when repeated incorrect password attempts, whether from a legitimate user or a malicious actor, reach the configured threshold within the specified window, the account is locked for the defined duration. During this lockout period, authentication is prohibited even if the correct credentials are provided. Cluster admins can review the account’s lockout status and manually unlock it if desired. Setting the threshold to zero disables the lockout mechanism altogether. Additionally, if failed attempts are spaced beyond the lockout window or a successful authentication occurs before the threshold is reached, the failure counter resets and no lockout is enforced.

So how does user account lockout work in practice?

  1. Starting with a PowerScale cluster running a fresh OneFS 9.13 install, a new user (‘testlock1’), is added to the system zone’s file provider.
# pw user add -n testlock1
  1. Next, the user ‘testlock1 is added to the ‘AuditAdmin’ role and the password is reset:
# isi auth roles modify AuditAdmin –add-user testlock1

# isi auth users reset-password testlock1

Z,71GGsuw,36l.XK
  1. The user’s lockout status can be verified as follows:
# isi auth users view testlock1 | grep -i lock

                  Locked: No

As expected, our new ‘testlock1 file provider user’s lockout status as not locked.

Since this is a fresh 9.13 install, the user lockout parameters are still their default configuration.

# isi auth file view System | grep -i lockout

       Lockout Duration: Now

      Lockout Threshold: 0

         Lockout Window: Now

As such, the lockout threshold value of ‘0’ above indicates that user account lockout is currently disabled.

  1. Next, the lockout-threshold is set to ‘3’, the lockout-duration to 60 seconds, and the lockout window 60 seconds too.
# isi auth file modify System --lockout-threshold=3 --lockout-duration=60 --lockout-window=60

Enabling the user lockout function may make the administrator account vulnerable to Denial of Service (DoS) attacks, potentially rendering the entire system unmanageable. Therefore, please choose the configuration values for lockout-duration and lockout-window carefully.

Be cautious when setting these values:

- Avoid setting lockout-duration to 0 (which means indefinitely) or a very long time, as this may result in being locked out for an extended period or even indefinitely.

- Avoid setting lockout-window to 0 (which means the failed attempt count will never be reset) or a very long time, as this may require waiting too long before the failed attempt is reset or may never be reset.

Additionally, to minimize the risk of Denial of Service (DoS) attacks, please configure the accounts that are excluded from the user lockout feature.

Are you sure you want to proceed with this action? (yes/[no]): yes

Before OneFS enables this configuration, it displays the above warning. This message warning that enabling lockout comes with the risk of DoS attacks by rendering the system unmanageable, and suggests excluding admin account(s).
  1. The success of the above ‘isi auth file modify’ command can be verified as follows:
# isi auth file view System | grep -i lockout

       Lockout Duration: 60

      Lockout Threshold: 3

         Lockout Window: 60
  1. After three attempts to log in as user ‘testlock1 with the wrong password within the lockout window of 60 seconds, this user ‘testlock1 is locked out:
login as: testlock1

Keyboard-interactive authentication prompts from server:

| Password:

End of keyboard-interactive prompts from server

Access denied

Keyboard-interactive authentication prompts from server:

| Password:

End of keyboard-interactive prompts from server

Access denied

Keyboard-interactive authentication prompts from server:

| Password:

End of keyboard-interactive prompts from server

Access denied

Keyboard-interactive authentication prompts from server:

| Password:

This can be verified from a cluster admin account, such as ‘root’, as follows:

# isi auth users view testlock1 | grep -i lock

                  Locked: Yes
  1. Since the lockout duration is also set to 60 seconds, after one minute this account will be unlocked.

Alternatively, this account can be unlocked manually by an administrator. For example:

# isi auth users view testlock1 | grep -i lock

                  Locked: Yes

# isi auth users modify testlock1 -–unlock

# isi auth users view testlock1 | grep -i lock

                  Locked: No

If a user is added to the exclusion list, the account, in this case ‘testlock1’ is automatically exempted from this lockout function. For example:

# isi_gconfig registry.Services.lsass.Parameters.Providers.File.Instance.System.LockoutExcludedUsers=’[“testlock1”]’

Note that OneFS does not check whether a user account name is valid when it is added to the exclusion list.

The lockout duration value can be specified in several ways. For example, a simple numeric value equates to seconds. For example:

# isi auth file modify System --lockout-duration=60

The above configuration will lockout for sixty seconds (one minute).

Other more convenient time period notation can also be used, such as M=minute, H=hour, D=day, W=week, etc.

For example, a two day lockout duration can be expressed as follows:

# isi auth file modify System --lockout-duration=1D

Or:

# isi auth file modify System --lockout-duration=48H

The user account lockout feature provides a configurable exclusion list, which allows certain users (eg. ‘root’ and/or ‘administrator’) to be exempted from lockout. This exclusion list is housed in gconfig, and is configured using the following ‘isi_gconfig’ CLI command permutations:

File Provider Action Command
System Modify isi_gconfig registry.Services.lsass.Parameters.Providers.File.Instance.System.LockoutExcludedUsers=’[“user1”, ”user2”]’
View isi_gconfig registry.Services.lsass.Parameters.Providers.File.Instance.System.LockoutExcludedUsers
Non-system Create isi_gconfig registry.Services.lsass.Parameters.Providers.File.Instance._key.<file_provider_name>._multi_sz.LockoutExcludedUsers._name=LockoutExcludedUsers
Modify isi_gconfig registry.Services.lsass.Parameters.Providers.File.Instance._key.<file_provider_name>._multi_sz.LockoutExcludedUsers.value=’[“user3”, “user4”]’
View isi_gconfig registry.Services.lsass.Parameters.Providers.File.Instance._key.<file_provider_name>._multi_sz.LockoutExcludedUsers

So, for example, the syntax for adding ‘testlock1’ and ‘testlock2’ system zone user accounts to the lockout exclusion list is as follows:

# isi_gconfig registry.Services.lsass.Parameters.Providers.File.Instance.System.LockoutExcludedUsers=’[“testlock1”, ”testlock2”]’

# isi_gconfig registry.Services.lsass.Parameters.Providers.File.Instance.System.LockoutExcludedUsers

registry.Services.lsass.Parameters.Providers.File.Instance.System.LockoutExcludedUsers (char**) = [ "testlock1", "testlock2" ]

Note that the system file provider exclusion list is already present by default, so there is no need for a create option. However, for a non-system zone file provider, the exclusion list needs to be created first, before it can be modified and/or viewed.

To guard against cluster admin accounts becoming inadvertently locked out, a recommended practice is generally to add ‘root’ and/or ‘administrator’ to the exclusion list. For example:

# isi_gconfig registry.Services.lsass.Parameters.Providers.File.Instance.System.LockoutExcludedUsers='["root","administrator"]'

# isi_gconfig registry.Services.lsass.Parameters.Providers.File.Instance.System.LockoutExcludedUsers

registry.Services.lsass.Parameters.Providers.File.Instance.System.LockoutExcludedUsers (char**) = [ "root", "administrator" ]

Also, be aware that configuring the ‘lockout duration’ parameter to ‘0’ means the account will never get unlocked automatically, so exercise caution when configuring lockout duration.

PowerScale OneFS 9.14

As we gear up for next month’s Dell Technologies World, PowerScale is welcoming spring with the debut of the innovative OneFS 9.14 release, which officially shipped today (April 8, 2026).

OneFS 9.14 brings a wave of enhancements across spectrum of the PowerScale platform. As the product continues to evolve, this release focuses on strengthening core functionality, expanding hardware and object support, delivering stronger security capabilities, improving serviceability, and elevating overall usability and customer experience.

Below is an early look at what’s coming, with deeper technical dives on individual features to follow in future posts.

Streamlined Deployment and Automation Enhancements

OneFS 9.14 introduces zero‑touch provisioning DHCP support, enabling nodes to automatically receive their IP addresses during deployment. This capability is designed to simplify large‑scale automated rollouts and reduce the operational overhead associated with manual node configuration.

The release also adds a new REST API for syslog management, giving customers the ability to automate creation and updates of syslog configurations. Instead of navigating the GUI and making manual adjustments, storage admins can now easily script and manage logging settings programmatically, making it ideal for environments with tightly automated and/or DevOps-driven workflows.

Customers who rely heavily on SmartQuotas quota description metadata gain more flexibility as well. The maximum description field size in configuration objects increases from 1 KB to 4 KB and 4095 ASCII characters, allowing for richer metadata that is easier to search, categorize, and align with operational requirements.

SMB and Object Storage Improvements

SMB environments will benefit from SMB2 durable handle support for static network pools, which keeps file handles active on the server briefly after a client disconnects. This means that if a connection drops, users can reconnect without re‑authenticating—improving application resilience while maintaining security boundaries.

On the object storage side, OneFS 9.14 introduces support for S3 CORS buckets, enabling modern web applications to retrieve and display resources without running into browser security restrictions. New S3 lifecycle‑management capabilities also arrive in this release, including automated cleanup of incomplete multipart uploads and rule‑based object deletion. These features help keep buckets clean, reduce storage waste, and simplify long-term data management.

Security Advancements

Security continues to be a critical pillar of the platform. OneFS 9.14 expands authentication capabilities by adding CAC/PIV support for LDAP server hosts, extending the existing HTTPS‑only support. This enhancement allows customers operating in high‑security environments, especially governmental or other regulated sectors, to integrate more seamlessly with their identity infrastructure.

Additionally, CAVA antivirus scanning now supports HTTPS, replacing the older HTTP requirement. As more customers move to encrypted communications by default, this enhancement ensures that antivirus scanning can remain active without compromising network security posture.

Platform & Hardware Enablement Updates

The release introduces backend support for the Dell Z9432 top‑of‑rack switch, enabling higher connectivity density. A second supplier option for Ethernet HB NICs (Broadcom) also enters the portfolio, expanding hardware flexibility and supply-chain resilience.

Serviceability receives a boost as well. A diagnostics tool previously reserved for internal service teams is being productized, providing the ability to capture deeper performance and slow‑processing data on demand. This tool can be activated and disabled by the customer and provides valuable insight during troubleshooting, helping reduce time to resolution.

Finally, there’s also new in‑band automation for upgrading or downgrading backend switch firmware, making infrastructure maintenance significantly easier. Customers gain additional control over their system health workflows with the ability to enable or disable automatic downloads of healthcare definitions—an important feature for environments with strict update governance.

In summary, OneFS 9.14 brings the following new features and functionality to the Dell PowerScale ecosystem:

Category Key Features
Unlock Platform Power for Gen AI ·         Conversion of front-end Ethernet to IB in F710, F910, & PA110

·         Dell Z9432 switch for Backend Flat/ToR Support

Objects Support Enhancements ·         S3 CORS buckets support

·         S3 Lifecycle management for incomplete MPU

·         S3 Lifecycle Management for buckets

Serviceability ·         Productize On-Slow-Op Processing

·         In-band Switch Upgrade for DNOS Flat topology in OneFS

·         Better support for bulk resolving of CELOG Events

·         Ability to enable/disable automatic download of HCF definitions and repair actions

Useability ·         DHCP support for OneFS for Zero Touch Provisioning

·         Rest access to create and update syslog configuration

·         Add custom metadata to quota description 1k to 4k increase

·         SMB2 durable handles for static network pools

Security ·         CAC/PIV Support with LDAP server host

·         HTTPS support in OneFS for CAVA

OneFS 9.14 is shaping up to be a significant release that strengthens the PowerScale ecosystem across automation, object storage, security, serviceability, and hardware support. With a blend of immediate production-ready enhancements and forward‑looking technical previews, this release continues the platform’s momentum toward greater scalability, operational simplicity, and enterprise-grade resilience. Stay tuned for deep-dive articles where we explore each feature in detail and discuss how customers can leverage them in real-world deployments.

We’ll be taking a deeper look at the new OneFS 9.14 features and functionality in blog articles over the course of the next few weeks.

Meanwhile, the new OneFS 9.14 code is available on the Dell Support site, as both an upgrade and reimage file, allowing both installation and upgrade of this new release.

For existing clusters running a prior OneFS release, the recommendation is to open a Service Request with to schedule an upgrade. To provide a consistent and positive upgrade experience, Dell Technologies is offering assisted upgrades to OneFS 9.14 at no cost to customers with a valid support contract. Please refer to this Knowledge Base article for additional information on how to initiate the upgrade process.