OneFS User Account Lockout for File Provider

OneFS 9.13 introduces a new user‑lockout security mechanism for file‑provider accounts to protect against brute‑force and password‑guessing attacks. While PowerScale has long supported lockout controls for local authentication providers, this release extends equivalent protection to file‑provider accounts.

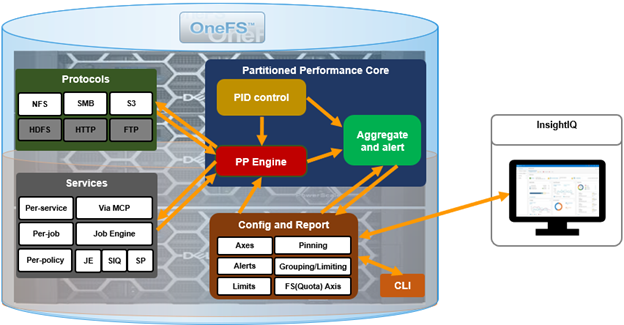
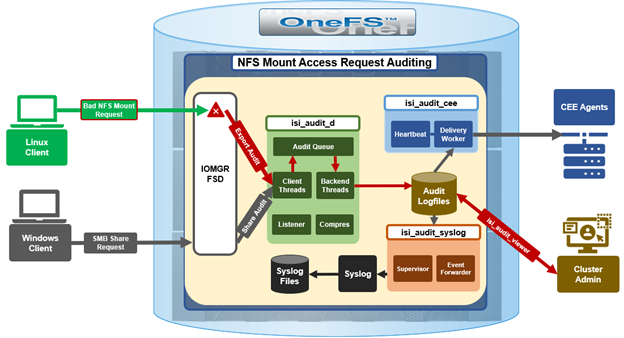
The OneFS user account security architecture can be summarized as follows:

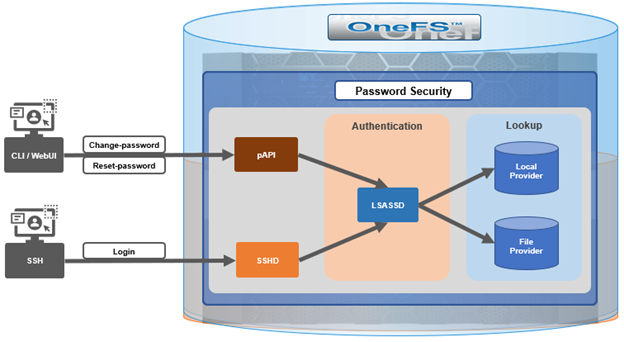
Within the OneFS security subsystem, authentication is handled in OneFS by LSASSD, the daemon used to service authentication requests for lwiod.

Component Description
LSASSD The local security authority subsystem service (LSASS) handles authentication and identity management as users connect to the cluster.
File provider The file provider includes users from /etc/password and groups from /etc/groups.
Local provider The local provider includes local cluster accounts like ‘anonymous’, ‘guest’, etc.
SSHD OpenSSH Daemon which provides secure encrypted communications between a client and a cluster node over an insecure network.
pAPI The OneFS Platform API (PAPI), which provides programmatic interfaces to OneFS configuration and management via a RESTful HTTPS service.

In OneFS Authentication, Identity Management, and Authorization (AIMA) there are several different kinds of backend providers: Local provider, file provider, AD provider, NIS provider, etc. Each provider is responsible for the management of users and groups inside the provider.

OneFS 9.13 introduces three new account lockout configuration parameters  for the file provider. First, the ‘lockout‑threshold’ parameter specifies the number of failed authentication attempts required before the account is locked. ‘Lockout‑window’ defines the time interval during which failed attempts are counted. If the user does not exceed the threshold within this window, the counter resets after the window expires. Finally, the ‘lockout‑duration’ parameter determines how long the account remains locked once the threshold has been exceeded.

In practice, when a legitimate user or malicious attacker enters an incorrect password repeatedly and the number of failures reaches the configured threshold within the defined window, the account is locked for the duration specified. During the lockout period, the account cannot authenticate even with a correct password. Administrators can view the account’s status and manually unlock it as needed. If the threshold is set to zero, the lockout feature is disabled. Additionally, if failed attempts occur but the user either waits longer than the lockout window or successfully authenticates before reaching the threshold, the failure counter resets and no lockout occurs.

Because some file‑provider accounts, such as root and administrator, are essential for cluster maintenance, misconfiguration or malicious use of this feature could create operational or denial‑of‑service risks. To mitigate this, OneFS 9.13 introduces an exclusion list that prevents designated accounts from being subject to lockout. Administrators can configure and modify this gconfig-based exclusion list  via the OneFS CLI. Modifying the exclusion list requires elevated operating‑system privileges, as it is intended to act as a safeguard rather than a routine configuration tool.

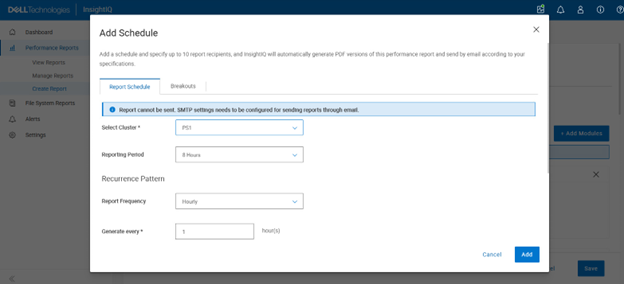
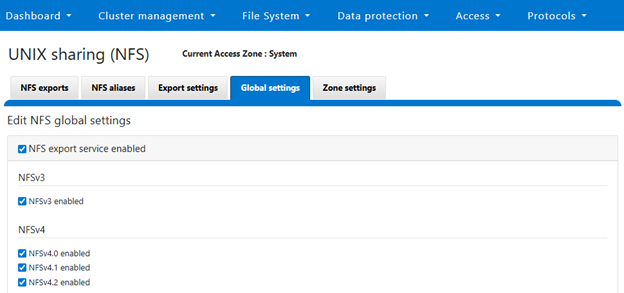
The lockout feature becomes available only after a OneFS 9.13 upgrade has been fully committed. Removing the upgrade also removes the associated configuration. No licensing is required to enable the feature. Three corresponding options are now available through the OneFS 9.13 CLI—lockout‑threshold, lockout‑window, and lockout‑duration—and can be set during provider creation or modified afterward.

Configuration is accessible through the WebUI under the Access, Membership, and Roles section, where password policies for local or file providers can be adjusted. Administrators can specify the threshold, window, and duration values, and may manually unlock accounts if needed. Setting the lockout duration to zero results in a permanent lockout until an administrator intervenes. The exclusion list for the system file provider is managed using the isi_gconfig interface, while non‑system file‑provider exclusion lists must first be created and then modified individually.

For troubleshooting, a new SQL‑backed IDDB file has been introduced to store user‑lockout data. This DB file is located at /ifs/.ifsvar/modules/auth/file/filelockout.db. While typically not required for routine administration, it can assist in diagnosing unexpected lockout behaviors.

OneFS also support an exclusion list for user lock-out functionality. In OneFS, certain local system accounts, such as root and administrator, are critical to cluster management and system access. If the account lockout mechanism is unintentionally enabled for these accounts, or if repeated failed login attempts occur (whether accidental or malicious), the resulting lockout could render the system unmanageable. This also presents a potential denial‑of‑service (DoS) vector, since an attacker could intentionally trigger lockouts on privileged accounts.

To mitigate this risk, OneFS introduces a configurable exclusion list. Any account added to this list is exempt from the lockout mechanism and will not be disabled, regardless of failed authentication attempts. The exclusion list can be configured and modified through the CLI, WebUI, or Platform API. Because this mechanism functions as a safety measure and last line of defense, it is exposed only through privileged configuration interfaces (for example, via gconfig), requiring elevated OS‑level permissions.

The lockout feature is controlled by the lockout threshold. When this threshold parameter is set to a non‑zero numerical value, the feature is activated. Conversely, when the threshold is set to 0 (the default), the lockout function is disabled.

A user will be locked out if they repeatedly enter incorrect credentials within the configured lockout window and reach the specified threshold. Immediately after lockout, the user cannot authenticate, even with a correct password, until an administrator reviews the account status and manually unlocks it.

Alternatively, if the user waits longer than the defined lockout window between failed attempts, the failure counter is reset to zero. At this point, an access attempt with the correct password entered will be successful.

In a scenario where a user does become locked out, there are two recovery methods:

Recovery Method Details
Automatic unlock After the lockout duration expires, the account unlocks automatically.
Administrative unlock A cluster administrator can manually unlock the account at any time.

Additionally, accounts may be added to the exclusion list, preventing them from being locked out in the future. OneFS distinguishes between the system file provider and non‑system file providers, and the procedure for adding accounts to the exclusion list differs slightly between the two.

Three new options have been added to the ‘isi auth file create/modify’ CLI command in OneFS 9.13 in support of this functionality:

Command Option Description
–lockout-duration Sets duration of time that an account will be inaccessible after multiple failed login attempts.
–lockout-threshold Sets the number of failed login attempts necessary for an account to be locked out.
–lockout-window Sets the duration of time in which –lockout-threshold failed attempts must be made for an account to be locked out.

The currently configured lockout parameters can be viewed as follows:

# isi auth file view System | grep -i lockout

Lockout Duration: 10m

Lockout Threshold: 0

Lockout Window: 5m

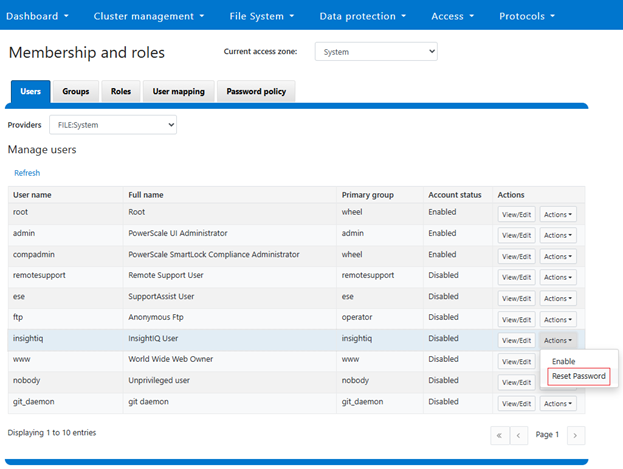
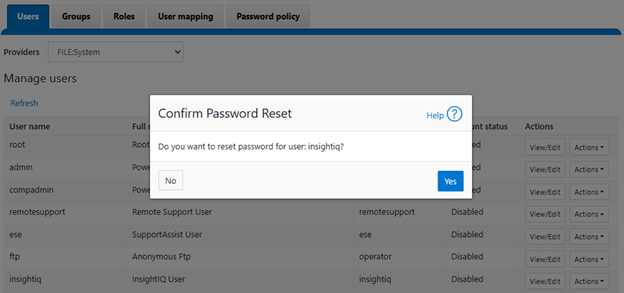
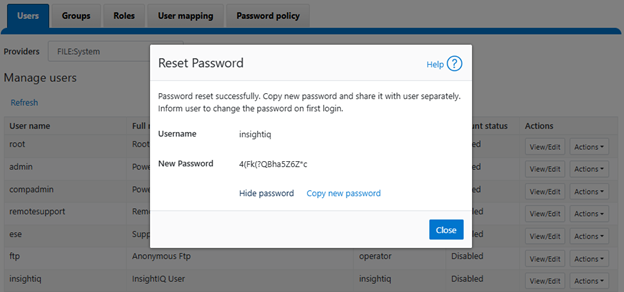
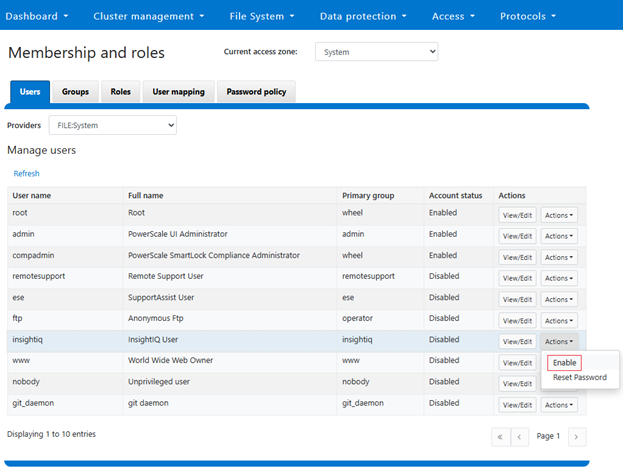
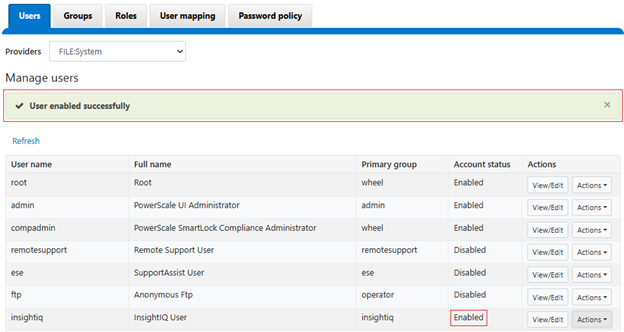
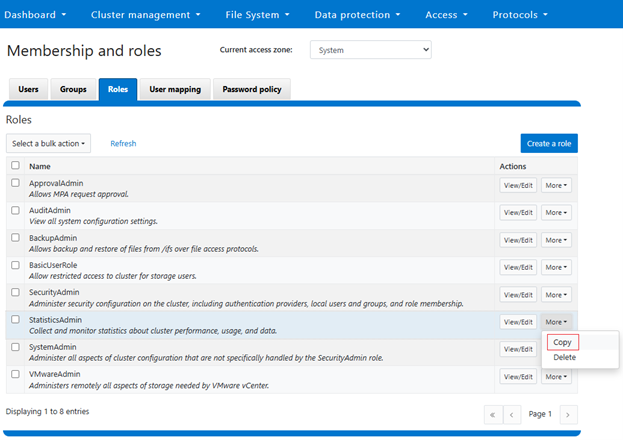
Alternatively, the user lockout configuration can also be accessed from the OneFS WebUI by navigating to Access > Membership and roles > Password policy, and selecting the desired provider:

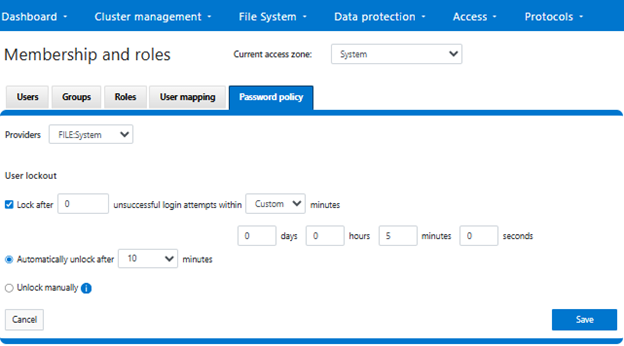
After selecting ‘FILE:System’ from the ‘Providers’ drop-down menu, the threshold lockout parameters are displayed and can be configured to specify how many unsuccessful login attempts within what length window (in minutes), and lock out for what duration. Alternatively, an option to ‘Unlock manually’ is also provided, if preferred. Note that the manual unlocking of a user account must be performed from the CLI or platform API since there is no WebUI support for this currently.

In the next article in this series, we will turn our focus to the configuration and management of the user account lockout functionality.

InsightIQ Partitioned Performance Reporting Configuration and Use

As we saw in the first article in this series, InsightIQ (IIQ) Partitioned Performance Reporting provides rich, long‑term visibility into activity at both the dataset and workload levels.

This enhanced visualization and historical context enables cluster admins to quickly identify which workloads consumed the most resources within a selected timeframe, whether measured by average utilization, peak consumption, or sustained high‑usage patterns from pinned workloads.

Within the OneFS and InsightIQ lexicon, a Partitioned Performance dataset is a formally defined set of performance criteria. This can be a specific directory path, share or export, user or group, client address, or access zone, for which OneFS continuously records detailed metrics (including protocol operations, bandwidth, disk activity, and CPU utilization). Whereas a Partitioned Performance workload is the resulting stream of I/O activity that matches one or more of these datasets, whose time‑series statistics InsightIQ ingests, aggregates, and presents as a distinct workload in its performance reports.

So how does Partitioned Performance Reporting actually work?

Here’s the general flow:

The base prerequisites for configuring and running Partitioned Performance Reporting are a PowerScale cluster, ideally running OneFS 9.5 or later, plus an InsightIQ instance running version 5.0 or later. The current IIQ version is 6.2, and is available in two deployment models.

Attribute InsightIQ 6.2 Simple InsightIQ 6.2 Scale
Scalability Up to 10 clusters or 252 nodes Up to 20 clusters or 504 nodes
Deployment On VMware, using OVA template RHEL, SLES, or Ubuntu with deployment script
Hardware requirements VMware v15 or higher:

·         CPU: 8 vCPU

·         Memory: 16GB

·         Storage: 1.5TB (thin provisioned);

Or 500GB on NFS server datastore

Up to 10 clusters and 252 nodes:

·         CPU: 8 vCPU or Cores

·         Memory: 16GB

·         Storage: 500GB

Up to 20 clusters and 504 nodes:

·         CPU: 12 vCPU or Cores

·         Memory: 32GB

·         Storage: 1TB

Networking requirements 1 static IP on the PowerScale cluster’s subnet 1 static IP on the PowerScale cluster’s subnet

The InsightIQ v6.2 ecosystem encompases VMware ESXi v9.0.1 and v8 OU3, Ubuntu 24.04 Online deployment and OpenStack RHOSP 21 with RHEL 9.6, SLES 15 SP4, and Red Hat Enterprise Linux (RHEL) versions 9.6 and 8.10.

Qualified on InsightIQ 6.1 InsightIQ 6.2
OS (IIQ Scale Deployment) RHEL 8.10, RHEL 9.6, and SLES 15 SP4 RHEL 8.10, RHEL 9.6, and SLES 15 SP4
PowerScale OneFS 9.5 or later OneFS 9.5 or later
VMware ESXi ESXi v8.0U3 ESXi v8.0U3, and ESXi v9.0.1
VMware Workstation Workstation 17 Free Version Workstation 17 Free Version
Ubuntu Ubuntu 24.04 Online deployment Ubuntu 24.04 Online deployment
OpenStack RHOSP 21 with RHEL 9.6 RHOSP 21 with RHEL 9.6

Similarly, in addition to deployment on VMware ESXi 8 and 9, the InsightIQ Simple version can also be installed for free on VMware Workstation 17, providing the ability to stand up InsightIQ in a non-production or lab environment for trial or demo purposes, without incurring a VMware licensing charge.

InsightIQ uses the OneFS platform  API in conjunction with an authenticated service account (typically the ‘insightiq’ user) to query cluster metrics and metadata on a schedule. It collects performance and health telemetry—cluster and node CPU, disk and protocol stats, client/workload metrics (via Partitioned Performance), plus capacity and configuration data—at different native sample lengths (for example ~30 seconds for CPU, up to ~5 minutes for capacity).

For Partitioned Performance, InsightIQ uses PP API endpoints to discover datasets (paths, users, clients, zones, etc.) and then polls their 30‑second statistics, ingesting them into its time‑series store and aggregating them into minute/hour/day buckets for reporting. File system analytics:

For File System Analytics, OneFS runs the FSAnalyze job on the cluster; that job writes an analytics dataset which InsightIQ then imports, rather than reading /ifs directly in real time.

InsightIQ’s collection engine writes the raw samples into its database, then its WebUI renders charts, tables, and reports (performance, health, capacity, partitioned performance, FSA) from those stored samples.

The specific process for configuring and viewing cluster performance reports via an InsightIQ monitoring instance are as follows:

  1. Enable the InsightIQ service account on the cluster

First, prepare the PowerScale cluster to be monitored by enabling the InsightIQ service account. This can be performed from the OneFS WebUI under Access > Membership and roles > Users. Select ‘FILE:System’ under the ‘Providers’ drop down list, and click ‘Reset Password’ under the ‘Actions’ option for the ‘insightiq’ user account:

Confirm at the popup prompt:

View and record the new password, which will be required when adding the cluster to InsightIQ:

Next, click ‘Enable’ under the ‘insightiq’ user ‘Actions’ drop down menu. For example:

When successfully activated, a confirmation banner will be displayed and the ‘insightiq’ user account marked as ‘Enabled’:

If the password reset step is missed, the following warning will be displayed when attempting to enable the ‘insightiq’ users:

  1. Create an InsightIQ RBAC role

Next, navigate to the ‘Roles’ tab and clone an ‘InsightIQ’ from the default ‘StatisticsAdmin’ role by clicking on copy:

Next, add the role name:

Next, search for the ‘insightiq’ user account from the ‘FILE:System’ provider, and click ‘Select user’:

Note that InsightIQ 5.0 and above has the ability to generate a Partition Performance Report for monitored clusters. To view this report for the PowerScale cluster being monitored requires the ‘ISI_PRIV_PERFORMANCE’ privilege with read permissions.

This can be done by scrolling down to the Performance section and clicking ‘R’ to enable read permissions:

Click ‘Next’, review the role and user configuration and click ‘Submit’:

A success banner and the new InsightIQ role are displayed:

  1. Add the cluster to InsightIQ

Next login in to the InsightIQ WebUI as ‘Administrator’. Add cluster under settings:

Initiating monitoring…

  1. Verify cluster monitoring is active

The green icon adjacent to the pertinent cluster indicates that initialization is complete and monitoring is now active:

  1. Select and View Performance Reports:

Navigating to Performance Reports > View Reports allows the desired cluster(s) to be selected:

The Performance Report types that can be selected include:

  • Cluster Performance
  • Node Performance
  • Network Performance
  • Client Performance
  • Disk Performance
  • File System Performance
  • File System Cache Performance
  • Cluster Capacity
  • Deduplication
  • Cluster Events
  • Partitioned Performance

For example:

In the following example, a partitioned performance report is selected for cluster ‘PS1’ with a duration window spanning the previous hour:

Clicking on ‘View Report’ shows both the default ‘system’ multi-tenant access zone plus any other custom multi-tenant access zones – in this case ‘zone1_pp’:

Selecting the funnel icon next to the dataset of choice allows filtering rules to be easily crafted:

Filtering criteria include:

Partitioned Performance Report Filters Options
Cache data type User data; Metadata
Dataset <name>
Direction In; Out
Disk <node>/Bay<num>
FS event Blocked; Contended; Deadlocked; Getattr; Link; Lock; Lookup; Read; Rename; Setattr; Unlink; Write
Interface <node>/ext-<interface>
Job ID <number>
Job type AVScan; AutoBalance; ChangelistCreate; Collect; ComplianecStoreDelete; Dedupe; DedupeAssessent; DomainMark; DomainTag; EsrsMftDownload; FSAnalyze; FilePolicy; Flexprotect; IndexUpdate; IntegrityScan, LinCount; MediaScan; MultiScan; PermissionRepair; QuotaScan; SetProtectPlus; ShadowStoreDelete; ShadowStoreProtect; SmartPools; SmartPoolsTree; SnapRevert; SnapshotDelete; TreeDelete; WormQueue
Node <node_ID>
Node (device ID) <device_ID>
Node pool <node_pool_name>
Op class Create; Delete; File_state; Namespace_read; Namespace_write; Other; Read; Session_state; Unimplemented; Write
Path <path_name>
Pinned workloads by average <value>
Protocol FTP; HDFS; HTTP; NFS; NFS3; NFS4; NFS4RDMA; NFSRDMA; NLM; pAPI; S3; SIQ; SMB; SMB1; SMB2
Service <name>
Tier <name>
Workloads by average <value>
Workloads by max values <value>

In addition to the standard reports, custom reports can also be crafted:

A range of performance modules can be selected for custom reports, including:

  • Active clients
  • Average cached data age
  • Average disk hardware latency
  • Average disk operation size
  • Average pending disk operations
  • Connected clients
  • Contended file system events
  • CPU % use
  • Dataset summary
  • Deadlocked file system events
  • Deduplication summary (logical)
  • Deduplication summary (physical)
  • Disk activity
  • Disk operations rate
  • Disk throughput rate
  • Event summary
  • External network errors
  • External network packets rate
  • External network throughput rate
  • File system events rate
  • File system throughput rate
  • Job workers
  • Jobs
  • L1 and L2 cache prefetch throughput
  • L1 cache throughput rate
  • L2 cache throughput rate
  • L3 cache throughput rate
  • Locked file system events rate
  • Node summary
  • Overall cache hit rate
  • Overall cache throughput rate
  • Pending disk operation latency
  • Protocol operations average latency
  • Protocol operations rate
  • Slow disk access rate
  • Workload CPU time
  • Workload IOPS
  • Workload L2/L3 cache hits
  • Workload latency
  • Workload throughput

For example:

Custom reports can have a schedule added:

Plus, up to ten report recipients can also be specified, and InsightIQ will automatically generate PDF versions of the performance report and distribute them via email.

Breakouts can also be selected for a report’s data modules, and the report will be generated with breakouts already applied to their respective modules:

The flexible visualization options of InsightIQ partitioned performance monitoring —combined with historical context—allows cluster administrators to quickly determine which workloads consumed the greatest share of resources during any selected timeframe. Usage can be evaluated by average utilization, peak demand, or sustained high‑usage patterns from pinned workloads. These PP reports also function as an effective diagnostic resource, enabling Dell Support to investigate, triage, and resolve customer performance concerns more efficiently.

As clusters grow and more simultaneous workloads compete for shared resources, ensuring fair resource allocation becomes increasingly complex. Partitioned Performance monitoring helps meet this challenge by allowing administrators to define, monitor, and respond to performance‑related conditions across the cluster. With this enhanced visibility, storage administrators can readily identify the dominant consumers of system resources, making it easier to spot rogue workloads, noisy‑neighbor processes that excessively use CPU, cache, or I/O bandwidth, or user activity that significantly affects overall cluster performance.

InsightIQ Partitioned Performance Reporting

PowerScale InsightIQ provides powerful performance and health monitoring and reporting functionality, helping to maximize PowerScale cluster efficiency. This includes advanced analytics to optimize applications, correlate cluster events, and the ability to accurately forecast future storage needs.

On PowerScale, Partitioned Performance (PP) is the OneFS metrics gathering and reporting framework that provides deep insight into workload behavior and resource consumption across a cluster. By integrating comprehensive performance accounting and control directly into OneFS, PP enables cluster admins to more precise visibility into how workloads utilize system resources.

InsightIQ’s Partitioned Performance Reporting provides rich, long‑term visibility into activity at both the dataset and workload levels, unlike OneFS’ native PP telemetry, which only offers limited historical performance information, .

This enhanced visualization and historical context enables cluster admins to quickly identify which workloads consumed the most resources within a selected timeframe, whether measured by average utilization, peak consumption, or sustained high‑usage patterns from pinned workloads. These PP reports also serve as a powerful diagnostic tool, allowing Dell Support to more efficiently investigate, triage, and resolve customer performance issues.

As clusters scale and an increasing number of concurrent workloads place greater demand on shared resources, maintaining equitable resource distribution becomes more challenging. Partitioned Performance monitoring helps address this need by enabling administrators to define, observe, and respond to performance‑related conditions within the cluster. This enhanced visibility allows storage administrators to identify the primary consumers of system resources, making it easier to detect rogue workloads, noisy‑neighbor processes consuming excessive CPU, cache, or I/O bandwidth, or users whose activities significantly impact overall system performance.

A Partitioned Performance workload is defined by a set of identification attributes paired with its measured consumption metrics. Datasets, conversely, describe how workloads should be grouped for meaningful analysis.

Category Description Example
Workload A set of identification and consumption metrics representing activity from a specific user, multi-tenant access zone, protocol, or similar attribute grouping. {username:nick, zone_name:System} consumed {cpu:1.2s, bytes_in:10K, bytes_out:20M, …}
Dataset A specification describing how workloads should be aggregated based on shared identification metrics. {username, zone_name}

Administrators can precisely define workloads based on attributes such as:

  • Directory paths
  • User identities
  • Client endpoints
  • Access protocols
  • Multi-tenant access zones

Workloads can then be analyzed through a variety of detailed performance metrics, including:

  • Protocol operations
  • Read and write throughput
  • CPU execution time
  • Latency
  • L2/L3 cache hit rates

InsightIQ uses OneFS platform API endpoints to gather dataset metadata and workload statistics at defined intervals, leveraging its established time‑series ingestion and storage framework. For example:

  • Retrieve workload statistics:
    https://<node>:8080/platform/10/statistics/history?keys=cluster.performance.dataset.<dataset-id>
  • Retrieve dataset list:
    https://<node>:8080/platform/10/performance/datasets
  • Full API description:
    https://<node>:8080/platform/10/performance?describe&list

Using the ‘insightiq’ service account with a specific PP privilege configured on each monitored cluster, InsightIQ discovers the PP datasets from the monitored cluster(s), periodically polls their  statistics via the PP APIs, stores the samples in the time‑series database, and then aggregates them into coarser time buckets (for example minutes, hours, or days). This allows IIQ to display per‑directory or per‑share throughput, per‑user or per‑client IOPS and bandwidth, and per‑zone resource consumption as the Partitioned Performance graphs and tables, with the report itself being a pre‑built view over these datasets that can be exported through the InsightIQ WebUI or REST API. Operationally, this means the PP‑backed views in InsightIQ are near‑real‑time (bounded by polling and aggregation), focused on isolating specific workloads within the cluster rather than just cluster‑wide aggregates, and cover the core protocols and services, plus other supported access patterns, with metrics per dataset.

InsightIQ’s TimescaleDB database permits the storage of long-term historical data via an enhanced retention strategy:

Unlike earlier InsightIQ releases, which used two data formats,  with IIQ v6.0 and later telemetry, summary data is now stored in the following cascading levels, each with a different data retention period:

Level Sample Length Data Retention Period
Raw table Varies by metric type. Raw data sample lengths range from 30s to 5m. 24 hours
5m summary 5 minutes 7 days
15m summary 15 minutes 4 weeks
3h summary 3 hours Infinite

Note that the actual raw sample length may vary by graph/data type – from 30 seconds for CPU % Usage data up to 5 minutes for cluster capacity metrics.

In the next article in this series, we’ll take a closer look InsightIQ Partitioned Performance Reporting configuration and use.

OneFS NFS Mount Failure Auditing

Auditing plays a critical role in identifying potential sources of data loss, fraud, inappropriate permissions, unauthorized access attempts, and other anomalous behaviors that indicate operational or security risk. Its value increases significantly when access events can be correlated with specific user identities.

To support strong data‑security practices, OneFS implements comprehensive ‘chain‑of‑custody’ auditing by recording defined activity across the cluster. This includes OneFS configuration changes as well as client operations over NFS, SMB, S3, and HDFS.

OneFS 9.13 introduces the auditing of NFS mount‑denial events, enabling organizations to easily detect unauthorized access attempts and meet corporate and Federal auditing and intrusion‑detection requirements. This new NFS functionality complements the SMB access‑denial auditing introduced in OneFS 9.5, allowing administrators to enable protocol auditing, configure audit zones, and integrate intrusion‑detection systems that analyze audit logs for suspicious behavior. Although the lack of logging  does not permit unauthorized access, it does allow such attempts to go unnoticed, which violates auditing guarantees required for certain compliance standards. All resulting events can be reviewed using the isi_audit_viewer tool.

When an NFS client issues a mount request, the request is processed by the NFS protocol head on the PowerScale cluster.

Successful mount operations return a success response to the client. When a mount request is denied, the protocol head explicitly invokes the Audit Filter APIs, which generate a share-access-check audit event. SMB and NFS share this same event type, although each protocol populates different subsets of fields. NFSv3 audit entries include the full path requested by the client, whereas NFSv4 may contain only a partial path due to the protocol’s directory traversal design. These events are visible only through isi_audit_viewer and are not exported via syslog or CEE.

A new ‘protocol’ field has been added to the ‘share-access-check’ event so that administrators can differentiate between NFS (including NFSv3 and NFSv4.x) and SMB access‑denial events. For example:

[3: Wed Feb  4 06:53:12 2026] {"id":"f1c21718-2b0f-11f0-8905-005056a0607c","timestamp":1746600792901821,"payloadType":"c411a642-c139-4c7a-be58-93680bc20b41","payload":{"protocol":"NFS","zoneID":1,"zoneName":"System","eventType":"create","detailType":"share-access-check","isDirectory":true,"desiredAccess":0,"clientIPAddr":"10.20.30.51","createDispo":0,"userSID":"S-1-22-1-0","userID":0,"userName":"","Domain":"","shareName":"\/ifs\/nfs_1","partialPath":"","ntStatus":3221225506}}

In the above example, the following fields and corresponding values are logged:

Field Value
protocol NFS
zoneID 1
zoneName System
eventType create
detailType share-access-check
isDirectory true
desiredAccess 0
clientIPAddr 10.20.30.51
createDispo 0
userSID S-1-22-1-0
userID 0
userName
Domain
shareName \/ifs\/nfs_1
partialPath
ntStatus 3221225506

Per the above, the above failed mount request for export ‘/ifs/nfs_1’ came from the ‘root’ user:

# isi auth mapping view UID:0 –zone system

Name: root

On-disk: UID:0

Unix uid: 0

Unix gid: -

SMB: S-1-22-1-0

The following procedure can be used to configure and manage NFS mount‑failure auditing in OneFS 9.13 and later:

  1. First, the NFS services must be enabled:
# isi services nfs enable

# isi nfs settings global modify --nfsv3-enabled TRUE

# isi nfs settings global modify --nfsv4-enabled TRUE

Or from the WebUI:

  1. Protocol auditing must then be activated and associated with the appropriate access zones:
# isi audit setting global modify --protocol-auditing-enabled TRUE

# isi audit setting global modify --audited-zones <zone name>

# isi audit settings modify --zone <zone name> --add-audit-failure share_access_check

Or from the WebUI:

  1. An NFS export can then be created. For example:
# mkdir /ifs/nfs_1

# isi nfs exports create /ifs/nfs_1 --clients 10.20.30.51

Or from the WebUI:

  1. In this example, only the client at 10.20.30.51 is allowed to mount the export. If a client outside the allowed list attempts to mount the directory, the request fails on the client side. For instance:
# mkdir -p /mnt/tst/nfs_1

# mount.nfs 10.20.30.252:/ifs/nfs_1 /mnt/tst/nfs_1 -n -o nfsvers=3

# mount.nfs: access denied by server while mounting 10.20.30.252:/ifs/nfs_1

Or for NFSv4:

# mount.nfs 10.20.30.252:/ifs/nfs_1 /mnt/tst/nfs_1 -n -o nfsvers=4

# mount.nfs: mounting 10.20.30.252:/ifs/nfs_1 failed, reason given by server: No such file or directory
  1. The corresponding audit entries can be viewed with:
# isi_audit_viewer -t protocol -v

Example output includes records such as:

[4: Wed Feb  4 06:53:29 2026] {"id":"fba69477-2b0f-11f0-8905-005056a0607c","timestamp":1746600809498757,"payloadType":"c411a642-c139-4c7a-be58-93680bc20b41","payload":{"protocol":"NFS4","zoneID":1,"zoneName":"System","eventType":"create","detailType":"share-access-check","isDirectory":true,"desiredAccess":0,"clientIPAddr":"10.20.30.51","createDispo":0,"userSID":"S-1-22-1-65534","userID":65534,"userName":"","Domain":"","shareName":"ifs","partialPath":"","ntStatus":3221225506}}

Note that there is no WebUI equivalent of the CLI-based ‘isi_audit_viewer’ utility.

Because of protocol differences, NFSv3 records contain the full mount path, while NFSv4 records may display only the first directory component where permission checking fails. In some cases, mount attempts do not generate server‑side audit entries at all. This occurs when the client IP is permitted but the user account is not: Linux NFS clients use an ‘ACCESS’ RPC to determine permissible operations on each path component. If ‘ACCESS’ returns insufficient permission, the client fails the mount without sending a ‘LOOKUP’ request. The server therefore sees only a successful ‘ACCESS’ operation and logs no audit event.

This release adds protocol identification to the share-access-check event. Prior to OneFS 9.13, only SMB access denials were audit logged, and without the ‘protocol’ information field. After upgrading, both SMB and NFS access‑denial events now include the new ‘protocol’ field.

Upgrade State Description
Before upgrading to OneFS 9.13 Shared-access-check support for SMB, without protocol field information.
Upon upgrade to OneFS 9.13 Shared-access-check support for both SMB & NFS, with protocol field information.
Upon downgrade from OneFS 9.13 Events logged post upgrade persist and are viewable using earlier version’s isi-audit-viewer.

Enabling auditing introduces general system overhead. However, the NFS mount‑denial auditing feature introduces no additional cost because it logs only unsuccessful mount attempts.

OneFS Support for 400Gb Ethernet

High-performance PowerScale workloads just gained a substantial new advantage. The all-flash F910 platform, in combination with the new OneFS 9.13 release, now supports next generation 400GbE networking, enabling faster data movement and smoother scalability. Whether powering AI pipelines or high-throughput analytics, 400GbE provides the headroom a high performance cluster needs to grow.

Native support for 400GbE front-end and/or backend networking on the F910, helps deliver next-generation bandwidth for performance-intensive workloads such as AI/ML pipelines, HPC, and high-throughput analytics.

This capability enables data movement and cluster expansion without architectural redesign, leveraging an existing NVIDIA SN5600 switch fabric if needed. The 400GbE implementation supports jumbo frames with RDMA over Converged Ethernet (RoCEv2) for low-latency data transfers, MTU sizes up to 9,000 bytes, and full compatibility with OneFS 9.13 or later releases using Dell-approved QSFP-DD optical modules. Clusters can scale up to 128 nodes while maintaining deterministic performance across Ethernet subnets.

With OneFS 9.13 400Gb Ethernet is supported for the F910 platform using the NVIDIA CX-8 PCIe gen6 network interface controller (NIC).

Under the hood, the 400GbE LNI type and the aggregate type have been added to OneFS, where it is registered as an ‘MCE 0123’ NIC, and works just as any other front-end or back-end NIC does. Additionally, the same driver is used for the CX-8 as the earlier generation of the NVIDIA CX cards, albeit with the higher bandwidth, and reported as ‘400gige’. For example:

# isi network interface list

LNN  Name      Status     VLAN ID  Owners                      Owner Type  IP Addresses

----------------------------------------------------------------------------------------

1    400gige-1 Up         -        groupnet0.subnet1.pool0     Static      10.20.30.51

1    400gige-2 Up         -        -                           -           -

1    mgmt-1    Up         -        groupnet0.subnet0.pool0     -           172.1.1.51

1    mgmt-2    No Carrier -        -                           -           -

2    400gige-1 Up         -        groupnet0.subnet1.pool0     Static      10.20.30.52

2    40gige-2  Up         -        -                           -           -

2    mgmt-1    Up         -        groupnet0.subnet0.pool0     -           172.1.1.52

2    mgmt-2    No Carrier -        -                           -           -

3    400gige-1 Up         -        groupnet0.subnet1.pool0     Static      10.20.30.53

3    400gige-2 Up         -        -                           -           -

3    mgmt-1    Up         -        groupnet0.subnet0.pool0     -           172.1.1.53

3    mgmt-2    No Carrier -        -                           -           -

----------------------------------------------------------------------------------------

Total: 12

Note that, unlike the 200GbE ConnectX‑6 adapter—which supports dual‑personality operation for either Ethernet or InfiniBand on the F-series nodes—the new 400Gbps ConnectX‑8 NIC is currently Ethernet‑only for PowerScale.

While 400GbE support in OneFS 9.13 is limited to the PowerScale F910 platform at launch, support for the F710 nodes and the PA110 accelerator is planned for an upcoming release.

This new NIC family is functionally similar to previous generations, with the primary difference being the increased line rate. It is designed for high‑performance workloads. The NVIDIA Spectrum‑4 SN5600 switch is required for the back‑end fabric, which currently limits cluster scalability to 128 nodes due to the absence of leaf‑spine support.

Support for Dell Ethernet switches will be introduced in a future release, but is not part of the current offering. Additionally, these new 400 GbE NICs cannot interoperate with 100GbE switches such as the Dell S5232, Z9100, or Z9264 series, as the technological differences between 100Gb and 400Gb Ethernet generations are too great to maintain compatibility. In OneFS, the adapters appear like any other NIC, identified simply as 400GbE interfaces.

Deploying 400GbE networking requires an F910 node pool running OneFS 9.13, along with compatible transceivers, cabling, and an NVIDIA Spectrum‑4 SN5600 switch.

Installation of 400GbE networking requires an F910 node pool running OneFS 9.13, plus transceivers, cables, and an NVIDIA Spectrum-4 5600 switch:

Component Requirement
Platform node ·         F910 with NVIDIA CX-8 NICs (front-end and/or back-end)

·         Cluster limited to a maximum of 128 nodes

OneFS version ·         OneFS 9.13 or later
Node firmware ·         NFP 13.2  with IDRAC 7.20.80.50
NIC transceiver ·         CX8 QSFP112 SR4 – Dell PN 024F8N (same as
NVIDIA MMA1Z00-NS400)
Switch transceiver ·         SN5600 QSFP112 SR4 Twin Port – Dell PN 070HK1 (same as
NVIDIA  MMA4Z00-NS)
Cable ·         Multimode APC Cables with MPO-12/APC connectors (no AOC cables)
Switch ·         NVIDIA Spectrum-4 SN5600

Additionally, the F910 nodes need to be running the latest node firmware package (NFP), as the iDRAC needs to support the card properly.

The current PowerScale 400GbE solution continues to use standard multimode optical modules, including the larger twin‑port module for the switch and the smaller QSFP‑112 SR4 module for the network adapter.

The Dell transceiver components are equivalent to the NVIDIA parts, as they are manufactured to the same specifications and differ only in part number.

With the 400 GbE generation, active optical cables (AOCs) are no longer supported. The increasing size and mechanical mass of the optical modules make AOCs unreliable and prone to damage at these speeds, so the architecture shifts fully to discrete optical transceivers and fiber cabling.

A significant consideration for new 400GbE PowerScale deployments is the transition to MPO‑12 APC (Angled Polish Connector) cabling. These connectors are identifiable by a green release sleeve, in contrast to the blue sleeve used on traditional UPC variants. For example:

APC cabling provides improved signal integrity; however, APC and UPC connectors are mechanically compatible.

Note that using a UPC cable in a 400GbE port will result in degraded signal quality or link instability. When installing 400GbE networking, verify that APC‑type MPO‑12 cables are used throughout a PowerScale F910 cluster’s 400Gb Ethernet network.

As mentioned previously, the NIC used in the F910 nodes for 400GbE connectivity is NVIDIA’s ConnectX‑8 PCIe Gen6 adapter with dual QSFP‑112 ports in a standard half‑height, half‑length form factor.

Note that this NIC’s power consumption exceeds 50 Watts, which leads the PowerScale F910 nodes to operate their cooling fans at high speed to manage thermal output. So additional fan noise from these 400GbE F910 nodes, as compared to their 100GbE and 200GbE variants, is not indicative of an issue.

Also note that the onboard hardware cryptographic engine in the CX-8 NIC is enabled by default, although it is not currently utilized by OneFS. However, this may be a relevant consideration for certain regulatory compliance or export‑control scenarios.

Network switching for 400GbE uses the NVIDIA Spectrum-4 SN5600 switch. As mentioned previously, active optical cables (AOCs) are not available at this speed class. However, a 3‑meter direct-attach copper cable (DAC) is qualified for in‑rack connections. For front‑end connectivity, multimode optical transceivers remain the recommended option, consistent with prior generations.

Due to the thermal characteristics of 400GbE optics and NICs, systems should be expected to operate fans at maximum speed under typical workloads.

Regarding compatibility with lower speed Ethernet connectivity, the F910’s 400GbE NIC does support 200GbE optics and cabling, and will happily down‑negotiate to 200GbE. However, it is unable to down‑negotiate to 100GbE.