OneFS Job Engine Smartthrottling – Configuration and Management

In this article we’ll dig into the details of configuring and managing SmartThrottling.

SmartThrottling intelligently prioritizes primary client traffic, while automatically using any spare resources for cluster housekeeping. It does this by dynamically throttling jobs forward and backward, yielding enhanced impact policy effectiveness, and improved predictability for cluster maintenance and data management tasks.

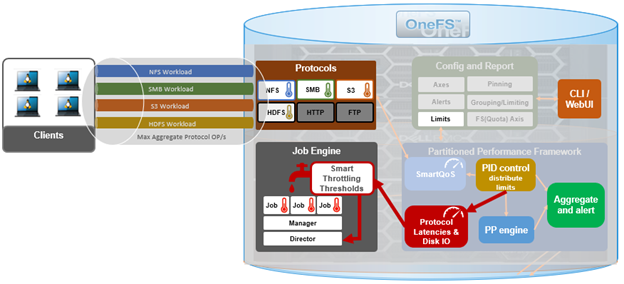
The read and write latencies of critical client protocol load are monitored, and SmartThrottling uses these metrics to keep the latencies within specified thresholds. As they approach the limit, the Job Engine stops increasing its work, and if latency exceeds the thresholds, it actively reduces the amount of work the jobs perform.

SmartThrottling also monitors the cluster’s drives and similarly maintains disk IO health within set limits. The actual job impact configuration remains unchanged in OneFS 9.8, and each job still has the same default level and priority as in prior releases.

Currently disabled by default on installation or upgrade to OneFS 9.8, SmartThrottling is currently recommended specifically for clusters that have experienced challenges related to the impact the Job Engine has on their workloads. For these environments, SmartThrottling should provide some noticeable improvements. However, like all 1.0 features, SmartThrottling does have some important caveats and limitations to be aware of in OneFS 9.8.

First, the SmartThrottling thresholds are currently global, so they treat all nodes equally. This means that lower powered nodes like the A-series might get impacted more than desired. This is especially germane for heterogenous clusters, with a range of differing node strengths within the cluster.

Second, it is also worth noting that, as PP performs its protocol monitoring at the IRP layer in the Likewise stack, so only NFS, SMB, S3, and HDFS are included.
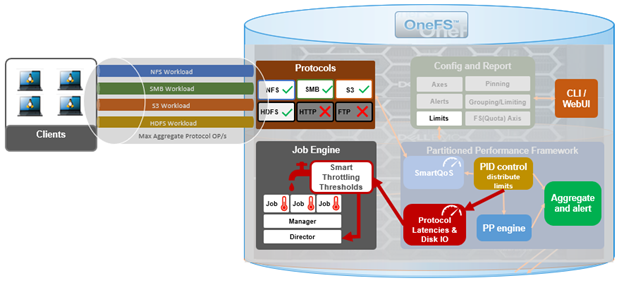
As such, FTP and HTTP, which don’t use Likewise, are not currently monitored by PP. So their latencies will not be considered, and the Job Engine will not notice if HTTP and FTP workloads are being impacted.

So these caveats are the main reason that SmartThrottling hasn’t been automatically enabled yet. But engineering’s plan is to make it even smarter and enable it by default in a future release.

Configuration-wise, SmartThrottling is pretty straightforward and via the CLI only, with no WebUI integration yet. The current state of throttling can be displayed with the ‘isi job settings view’ command:

# isi job settings view

  Parallel Restriper Mode: All

          Smartthrottling: False

It can also be easily enabled or disabled via a new ‘smartthrottling’ switch for ‘isi job settings modify’.

For example, to enable SmartThrottling:

# isi job settings modify --smartthrottling enable

Or to disable:

# isi job settings modify --smartthrottling disable

Running this command will cause the Job Engine to restart, temporarily pausing and resuming any running jobs, after which they will continue where they left off and run to completion as normal.

For advanced configuration, there are three main threshold options. These are:

  • Target read latency for protocol operations.
  • Target write latency thresholds for protocol operations.
  • Disk IO time in queue threshold.

These thresholds can be viewed as follows:

# isi performance settings view

                                           Top N Collections: 1024

                                Time In Queue Threshold (ms): 10.00

                         Target read latency in microseconds: 12000.0

                        Target write latency in microseconds: 12000.0

                                  Protocol Ops Limit Enabled: Yes

Medium impact job latency threshold modifier in microseconds: 12000.0

High impact job latency threshold modifier in microseconds: 24000.0

The target read and write latency thresholds default to 12 milliseconds (ms) for low impact jobs, and are the thresholds at which SmartThrottling begins to throttle the work. There are also modifiers for both medium and high impact jobs, which are set to an additional 12 ms and 24 ms respectively by default. So for medium impact jobs, throttling will start to kick in around 20 ms, and then really throttle the job engine at 24 ms. It needs to be this high in order to maintain the mean time to data loss metrics for the FlexProtect job. Similarly, for the high impact jobs throttling starts at 30 ms and ramps up at 36 ms. But currently there are no default high impact jobs, so this level would have to be configured manually for a job.

Since SmartThrottling is currently configured for average, middle-of-the-road clusters, these advanced settings allow job engine throttling to be tuned for specific customer environments, if necessary. This can be done via the ‘isi performance settings modify’ CLI command and the  following options:

# isi performance settings modify --target-protocol-read-latency-usec <int>

                          --target-protocol-write-latency-usec

                          --medium-impact-modifier-usec

                          --high-impact-modifier-usec

                          --target-disk-time-in-queue-ms

That’s pretty much it for configuration in OneFS 9.8, although engineering will likely be adding additional tunables in a future release, when job throttling is enabled by default.

In OneFS 9.8, the default SmartThrottling thresholds target average clusters. This means that the default latency thresholds are likely much higher than desired for all-flash nodes.

So F-series clusters usually respond well to setting thresholds considerably lower than 12 milliseconds. But since there’s little customer data at this point, there really aren’t any hard and fast guidelines yet, and it’ll likely require some experimentation.

The are also some idiosyncrasies and considerations to bear in mind with job throttling, particularly if a cluster become idle for a period. That is if no protocol load occurs – then the job engine will ramp up to use more resources. This means that when client protocol load does return, the job engine will be consuming more than its fair share of cluster resources. Typically, this will auto-correct itself rapidly in most circumstances. However, if A-series nodes are being used for protocol load, which is not a recommended use case for SmartThrottling, then this auto-correction may take longer than desired. This is another scenario that engineering will address before SmartThrottling becomes prime-time and enabled by default. But for now, possible interim solutions are either:

  • Moving protocol load away from archive class nodes

Or:

  • Disabling the use of SmartThrottling and letting ‘legacy’ job engine impact management continue to function, as it does in earlier OneFS versions.

Also, since a cluster has a finite quantity of resources, if it’s being pushed hard and protocol operation latency is constantly over the threshold, jobs will be throttled to their lowest limit. This is similar to the legacy job engine throttling behavior, except that it’s now using protocol operation latency instead of other metrics. The job will continue to execute but, depending on the circumstances, this may take longer than desired. Again, this is more frequently seen on the lower-powered archive class nodes. Possible solutions here include:

  • Decreasing the cluster load so protocol latency recovers.
  • Increasing the impact setting of the job so that it can run faster.
  • Or tuning the thresholds to more appropriate values for the workload.

When it comes to monitoring and investigating SmartThrottling’s antics, there are a handful of logs that are a good place to start. First, there’s a new job engine throttling job, which contains information on the current work counts, throttling decisions, and their causes. The next place to look is the partitioned performance daemon log. This daemon is responsible for monitoring the cluster and setting throttling limits, and monitoring and throttling information and errors may be reported here. It logs the current metrics it sees across the cluster, and the job throttles it calculates from them. And finally, the standard job engine logs, where information and errors are typically reported.

Log File Location Description
Throttling log /var/log/isi_job_d_throttling.log Contains information on the current worker counts, throttling decisions, and their causes.
PP log /var/log/isi_pp_d.log The partitioned performance daemon is responsible for monitoring the cluster and setting throttling limits. Monitoring and throttling information and errors may be reported here. It logs the current metrics is sees across the cluster and the job throttles it calculates from them.
Job engine log /var/log/isi_job_d.log Job and job engine information and errors may be reported here.


OneFS Job Engine SmartThrottling Architecture

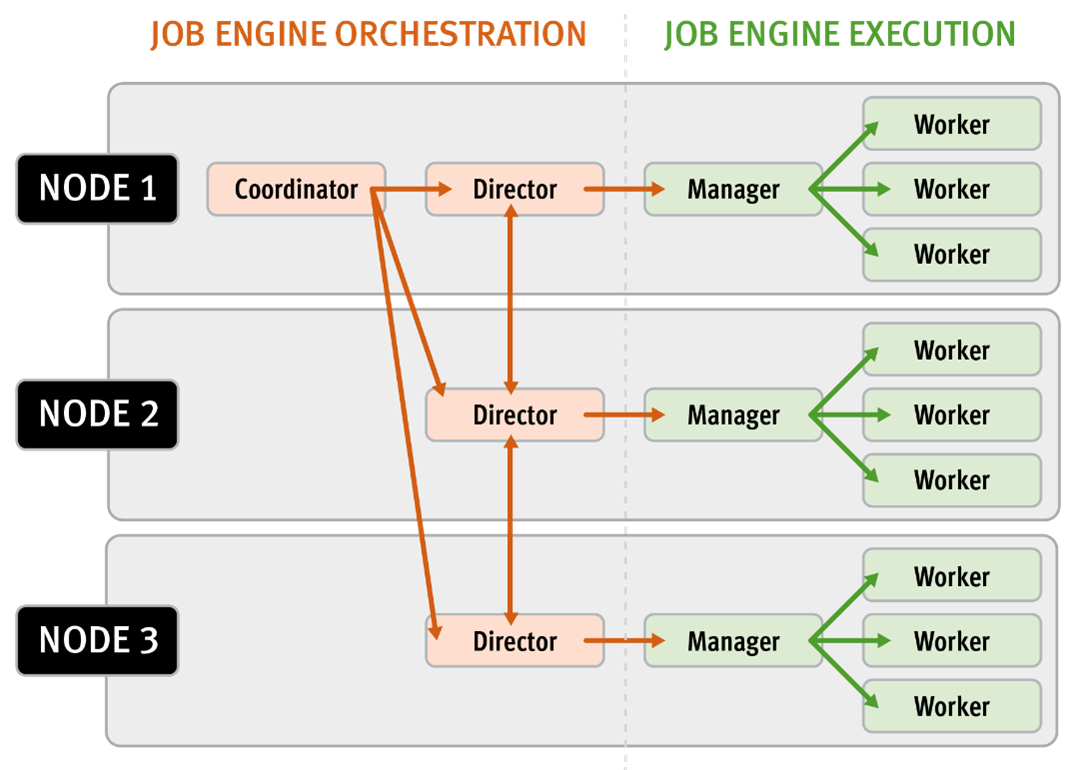
Prior to SmartThrottling, the native Job Engine resource monitoring and processing framework has allowed jobs to be throttled based on both CPU and disk I/O metrics. This legacy process still operates in OneFS 9.8 when SmartThrottling is not running. The coordinator itself does not communicate directly with the worker threads, but rather with the director process, which in turn instructs a node’s manager process for a particular job to cut back threads.

For example, if the Job Engine is running a job with LOW impact and CPU utilization drops below the threshold, the worker thread count is gradually increased up to the maximum defined by the LOW impact policy threshold. If client load on the cluster suddenly spikes, the number of worker threads is gracefully decreased. The same principle applies to disk I/O, where the Job Engine throttles back in relation to both IOPS as well as the number of I/O operations waiting to be processed in any drive’s queue. Once client load has decreased again, the number of worker threads is correspondingly increased to the maximum LOW impact threshold.

Every 20 seconds, the coordinator process gathers cluster CPU and individual disk I/O load data from all the nodes across the cluster. The coordinator uses this information, in combination with the job impact configuration, to determine how many threads may run on each cluster node to service each running job. This number can be fractional, and fractional thread counts are achieved by having a thread sleep for a given percentage of each second.

Using this CPU and disk I/O load data, every 60 seconds the coordinator evaluates how busy the various nodes are and makes a job throttling decision, instructing the various Job Engine processes as to the action they need to take. This enables throttling to be sensitive to workloads in which CPU and disk I/O load metrics yield different results. Additionally, separate load thresholds are tailored to the different classes of drives used in OneFS powered clusters, including high-speed SAS drives, lower-performance SATA disks, and flash-based solid state drives (SSDs).

The Job Engine allocates a specific number of threads to each node by default, thereby controlling the impact of a workload on the cluster. If little client activity is occurring, more worker threads are spun up to allow more work, up to a predefined worker limit. For example, the worker limit for a LOW impact job might allow one or two threads per node to be allocated, a MEDIUM impact job from four to six threads, and a HIGH impact job a dozen or more. When this worker limit is reached (or before, if client load triggers impact management thresholds first), worker threads are throttled back or terminated.

For example, a node has four active threads, and the coordinator instructs it to cut back to three. The fourth thread is allowed to finish the individual work item it is currently processing, but then quietly exit, even though the task as a whole might not be finished. A restart checkpoint is taken for the exiting worker thread’s remaining work, and this task is returned to a pool of tasks requiring completion. This unassigned task is then allocated to the next worker thread that requests a work assignment, and processing continues from the restart checkpoint. This same mechanism applies in the event that multiple jobs are running simultaneously on a cluster.

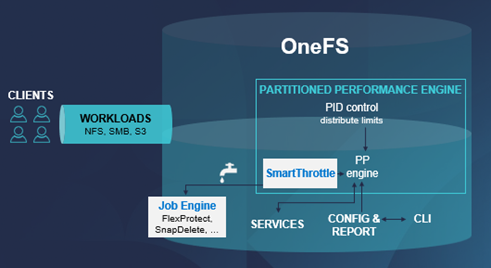
In contrast to this legacy job Engine impact management process, SmartThrottling instead draws its metrics from the OneFS Partitioned Performance (PP) framework. This framework is the same telemetry source that SmartQoS uses to limit client protocol operations.

Under the hood, SmartThrottling operates as follows:

  1. First, Partitioned Performance directly monitors the cluster resource usage at the IRP layer, paying attention to the latencies of the critical client protocol load.
  2. Based on these PP metrics, the Job Engine then attempts to maintain latencies within a specified threshold.
  3. If they approach the configured upper bound, PP directs the Job Engine to stop increasing the amount of work performed.
  4. If the latencies exceed those thresholds, then the Job Engine actively reduces the amount of work performed by quiescing job worker threads as necessary.
  5. There’s also a secondary throttling mechanism for situations when no protocol load exists, to prevent the Job Engine from commandeering all the cluster resources. This backup throttling monitors the drives, just in case there’s something else going on that’s causing the disks to become overloaded – and similarly attempts to maintain disk IO health within set limits.

The SmartThrottling thresholds, and the rate of ramping up or down the amount of work, differs based on the impact setting of a specific job. The actual Job impact configuration remains unchanged from earlier releases, and can still be set to Low, Medium, or High. And each job still has the same default impact level and priority, which can be further adjusted if desired.

Note that, since the new SmartThrottling is a freshly introduced feature at this point, it is currently disabled by default in OneFS 9.8 in an abundance of caution. So it needs to be manually enabled if you want it to run.

In the next article in this series, we’ll dig into the details of configuring and managing SmartThrotting.

OneFS Job Engine SmartThrottling

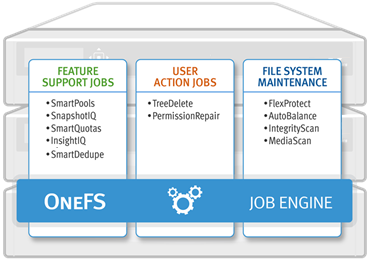
Within a PowerScale cluster, the OneFS Job Engine framework performs the background maintenance work on the cluster. It’s always there, but jobs come and go, and are run as necessary. Some of them are scheduled and executed automatically by the cluster, while others are run manually by cluster admins. Some of these jobs are very time critical like FlexProtect, who’s responsibility it is to reprotect data and help maintain and cluster’s availability and durability SLAs. Other jobs are less essential and perform general maintenance work, some optimizations, feature support, etc. And these can typically run with less criticality and a lower impact.

Some cluster administrators are blissfully unaware of the Job Engine’s existence, as it does its thing discretely behind the scenes, while others are distinctly more familiar with it.

The job engine uses the same set of resources as any clients accessing cluster. So the job engine has to manage how much CPU, memory, disk IO, etc, it uses, to avoid impinging upon client workloads. Obviously, if it consumes too much, the client loads will start to slow down and negatively impact customer productivity. The job engine manages its impact on client activity based on a set of internal disk IO and CPU metrics. But, until now, it has not paid attention to client load performance directly. So for protocol activity, the Job Engine in OneFS 9.7 and earlier does not monitor whether or not the latencies of protocol operations increase due to the jobs its running. And unfortunately, sometimes this results in client workloads being impacted more than desired. So OneFS 9.8 attempts to directly address this undesirable situation.

At its core, SmartThrottling is the Job Engine’s new automatic impact management framework.

As such, it intelligently prioritizes primary client traffic, while automatically using any spare resources for cluster housekeeping.

It does this by dynamically throttling jobs forward and backward. And this means enhanced impact policy effectiveness, and improved predictability for cluster maintenance and data management tasks.

The read and write latencies of critical client protocol load are monitored, and SmartThrottling uses these metrics to keep the latencies within specified thresholds. As they approach the limit, the Job Engine stops increasing its work, and if latency exceeds the thresholds, it actively reduces the amount of work the jobs perform.

SmartThrottling also monitors the cluster’s drives and similarly maintains disk IO health within set limits. The actual job impact configuration remains unchanged in OneFS 9.8, and each job still has the same default level and priority as in prior releases.

But before we get into the nitty gritty of SmartThrottling, first, a quick Job Engine refresher.

The OneFS Job Engine itself is based on a delegation hierarchy made up of coordinator, director, manager, and worker processes.

Once the work is initially allocated, the Job Engine uses a shared work distribution model to process the work, and a unique Job ID identifies each job. When a job is launched, whether it is scheduled, started manually, or responding to a cluster event, the Job Engine spawns a child process from the isi_job_d daemon running on each node. This Job Engine daemon is also known as the parent process.

The Job Engine’s orchestration and job execution is handled by the coordinator process. Any node can act as the coordinator, and its principal responsibilities include:

  • Monitoring workload and the constituent nodes’ status
  • Controlling the number of worker threads per node and clusterwide
  • Managing and enforcing job synchronization and checkpoints

While the individual nodes manage the actual work item allocation, the coordinator node takes control, divvies up the job, and evenly distributes the resulting tasks across the nodes in the cluster. The coordinator also periodically sends messages, through the director processes, instructing the managers to increment or decrement the number of worker threads as appropriate.

The coordinator is also responsible for starting and stopping jobs, and for processing work results as they are returned during job processing. Should it die for any reason, the coordinator responsibility automatically moves to another node.

Each node in the cluster has a Job Engine director process, which runs continuously and independently in the background. The director process is responsible for monitoring, governing, and overseeing all Job Engine activity on a particular node, constantly waiting for instruction from the coordinator to start a new job. The director process serves as a central point of contact for all the manager processes running on a node and as a liaison with the coordinator process across nodes. These responsibilities include manager process creation, delegating to and requesting work from other peers, and communicating status.

As such, the manager process is responsible for arranging the flow of tasks and task results throughout the duration of a job. The various manager processes request and exchange work with each other and supervise the worker threads assigned to them. At any time, each node in a cluster can have up to three manager processes, one for each job currently running. These managers are responsible for overseeing the flow of tasks and task results.

Each manager controls and assigns work items to multiple worker threads working on items for the designated job. Under direction from the coordinator and director, a manager process maintains the appropriate number of active threads for a configured impact level, and for the node’s current activity level. Once a job has been completed, the manager processes associated with that job, across all the nodes, are terminated. New managers are automatically spawned when the next job begins.

The manager processes on each node regularly send updates to their respective node’s director, which, in turn, informs the coordinator process of the status of the various worker tasks.

Each worker thread is given a task, if available, which it processes item-by-item until the task is complete or the manager unassigns the task. You can query the status of the nodes’ workers by running the CLI command isi job statistics view. In addition to the number of current worker threads per node, the query also provides a sleep-to-work (STW) ratio average, giving an indication of the worker thread activity level on the node.

Towards the end of a job phase, the number of active threads decreases as workers finish their allotted work and become idle. Nodes that have completed their work items remain idle, waiting for the last remaining node to finish its work allocation. When all tasks are done, the job phase is considered to be complete, and the worker threads are terminated.

As jobs are processed, the coordinator consolidates the task status from the constituent nodes and periodically writes the results to checkpoint files. These checkpoint files allow jobs to be paused and resumed, either proactively or in the event of a cluster outage. For example, if the node on which the Job Engine coordinator is running goes offline for any reason, a new coordinator automatically starts on another node. This new coordinator reads the last consistency checkpoint file, job control and task processing resume across the cluster, and no work is lost.

Each Job Engine job has an associated impact policy, dictating when a job runs and the resources that a job can consume. The default Job Engine impact policies are as follows:

Impact policy Schedule Impact level
LOW Any time of day Low
MEDIUM Any time of day Medium
HIGH Any time of day High
OFF_HOURS Outside of business hours (9 a.m. to 5 p.m., Monday to Friday), paused during business hours Low

While these default impact policies cannot be modified or deleted, additional custom impact policies can be manually created as needed.

A mix of jobs with different impact levels results in resource sharing. Each job cannot exceed the impact level set for it, and the aggregate impact level cannot exceed the highest level of the individual jobs.

In addition to the impact level, each Job Engine job also has a priority. These are based on a scale of one to ten, with a lower value signifying a higher priority. This is similar in concept to the UNIX ‘nice’ scheduling utility.

Higher-priority jobs cause lower-priority jobs to be paused. If a job is paused, it is returned to the back of the Job Engine priority queue. When the job reaches the front of the priority queue again, it resumes from where it left off. If the system schedules two jobs of the same type and priority level to run simultaneously, the job that was queued first runs first.

Priority takes effect when two or more queued jobs belong to the same exclusion set, or when, if exclusion sets are not a factor, four or more jobs are queued. The fourth queued job may be paused if it has a lower priority than the three other running jobs.

In contrast to priority, job impact policy only comes into play once a job is running and determines the resources a job can use across the cluster.

The FlexProtect, FlexProtectLIN, and IntegrityScan jobs have the highest Job Engine priority level of 1, by default. Of these, the FlexProtect jobs, having the core role of reprotecting data, are the most important.

All Job Engine job priorities are configurable by the cluster administrator. The default priority settings are strongly recommended, particularly for the highest-priority jobs.

The default impact policy and relative priority settings for the range of Job Engine jobs are as follows. Typically, the elevated impact jobs are also run at an increased priority. Note that the recommendation is to keep the default impact and priority settings, where possible, unless there is a compelling reason to change them.

Job name Impact policy Priority
AutoBalance LOW 4
AutoBalanceLIN LOW 4
AVScan LOW 6
ChangelistCreate LOW 5
Collect LOW 4
ComplianceStoreDelete LOW 6
Deduplication LOW 4
DedupeAssessment LOW 6
DomainMark LOW 5
DomainTag LOW 6
FilePolicy LOW 6
FlexProtect MEDIUM 1
FlexProtectLIN MEDIUM 1
FSAnalyze LOW 6
IndexUpdate LOW 5
IntegrityScan MEDIUM 1
MediaScan LOW 8
MultiScan LOW 4
PermissionRepair LOW 5
QuotaScan LOW 6
SetProtectPlus LOW 6
ShadowStoreDelete LOW 2
ShadowStoreProtect LOW 6
ShadowStoreRepair LOW 6
SmartPools LOW 6
SmartPoolsTree MEDIUM 5
SnapRevert LOW 5
SnapshotDelete MEDIUM 2
TreeDelete MEDIUM 4
WormQueue LOW 6

The majority of Job Engine jobs are intended to run in the background with LOW impact. Notable exceptions are the FlexProtect jobs, which by default are set at MEDIUM impact. This allows FlexProtect to quickly and efficiently reprotect data without critically affecting other user activities.

In the next article in this series, we’ll delve into the architecture and operation of SmartThrottling.

PowerScale OneFS 9.8

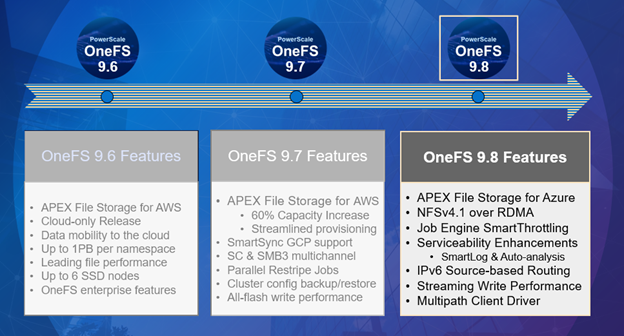
It’s launch season here at Dell, and PowerScale is already scaling up spring with the introduction of the innovative OneFS 9.8 release, which shipped today (9th April 2024). This new 9.8 release has something for everyone, introducing PowerScale innovations in cloud, performance, serviceability, and ease of use.

APEX File Storage for Azure

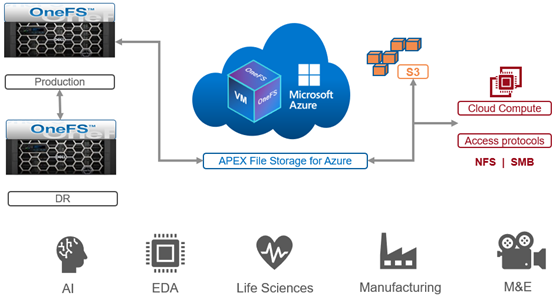
After the debut of APEX File Storage for AWS last year, OneFS 9.8 amplifies PowerScale’s presence in the public cloud by introducing APEX File Storage for Azure.

In addition to providing the same OneFS software platform on-prem and in the cloud, and customer-managed for full control, APEX File Storage for Azure in OneFS 9.8 provides linear capacity and performance scaling from four up to eighteen SSD nodes and up to 3PB per cluster. This can make it a solid fit for AI, ML and analytics applications, as well as traditional file shares and home directories, and vertical workloads like M&E, healthcare, life sciences, and financial services.

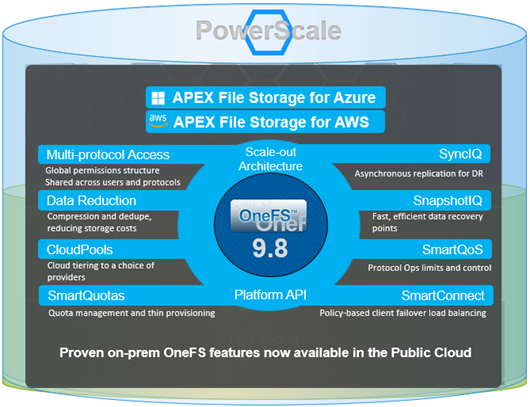
PowerScale’s scale-out architecture can be deployed on customer managed AWS and Azure infrastructure, providing the capacity and performance needed to run a variety of unstructured workflows in the public cloud.

Once in the cloud, existing PowerScale investments can be further leveraged by accessing and orchestrating your data through the platform’s multi-protocol access and APIs.

This includes the common OneFS control plane (CLI, WebUI, and platform API), and the same enterprise features: Multi-protocol, SnapshotIQ, SmartQuotas, Identity management, etc.

Simplicity and Efficiency

OneFS 9.8 SmartThrottling is an automated impact control mechanism for the job engine, allowing the cluster to automatically throttle job resource consumption if it exceeds pre-defined thresholds, in order to prioritize client workloads.

OneFS 9.8 also delivers automatic on-cluster core file analysis, and SmartLog provides an efficient, granular log file gathering and transmission framework. Both these new features help dramatically accelerate the ease and time to resolution of cluster issues.

Performance

OneFS 9.8 also adds support for Remote Direct Memory Access (RDMA) over NFS 4.1 support for applications and clients, allowing substantially higher throughput performance, especially for single connection and read intensive workloads such as machine learning and generative AI model training – while also reducing both cluster and client CPU utilization. It also provides the foundation for interoperability with NVIDIA’s GPUDirect.

RDMA over NFSv4.1 in OneFS 9.8 leverages the ROCEv2 network protocol. OneFS CLI and WebUI configuration options including global enablement, and IP pool configuration, filtering and verification of RoCEv2 capable network interfaces. NFS over RDMA is available on all PowerScale platforms containing Mellanox ConnectX network adapters on the front end, and with a choice of 25, 40, or 100 Gigabit Ethernet connectivity. The OneFS user interface helps easily identify which of a cluster’s NICs support RDMA.

Under the hood, OneFS 9.8 also introduces efficiencies such as lock sharding and parallel thread handling, delivering a substantial performance boost for streaming write heavy workloads, such as generative AI inferencing and model training. Performance scales linearly as compute is increased, keeping GPUs busy, and allowing PowerScale to easily support AI and ML workflows from small to large. Plus 9.8 also includes infrastructure support for future node hardware platform generations.

Multipath Client Driver

The addition of a new Multipath Client Driver helps expand PowerScale’s role in Dell’s strategic collaboration with NVIDIA, delivering the first and only end-to-end large scale AI system. This is based on the PowerScale F710 platform, in conjunction with PowerEdge XE9680 GPU servers, and NVIDIA’s Spectrum-X Ethernet switching platform, to optimize performance and throughput at scale.

In summary, OneFS 9.8 brings the following new features to the Dell PowerScale ecosystem:


Feature Info
Cloud ·         APEX File Storage for Azure.

·         Up to 18 SSD nodes and 3PB per cluster.

Simplicity ·         Job Engine SmartThrottling.

·         Source-based routing for IPv6 networks.

Performance ·         NFSv4.1 over RDMA.

·         Streaming write performance enhancements.

·         Infrastructure support for next generation all-flash node hardware platform.

Serviceability ·         Automatic on-cluster core file analysis.

·         SmartLog efficient, granular log file gathering.


We’ll be taking a deeper look at this new functionality in blog articles over the course of the next few weeks.

Meanwhile, the new OneFS 9.8 code is available on the Dell Online Support site, both as an upgrade and reimage file, allowing installation and upgrade of this new release.

OneFS Cluster Quorum – Part 2

The CAP theorem states that a distributed system cannot simultaneously guarantee consistency, availability, and partition tolerance. This means that, when faced with a network partition, a choice must be made between consistency and availability. OneFS does not compromise on consistency, so a mechanism is required to manage a cluster’s transient state.

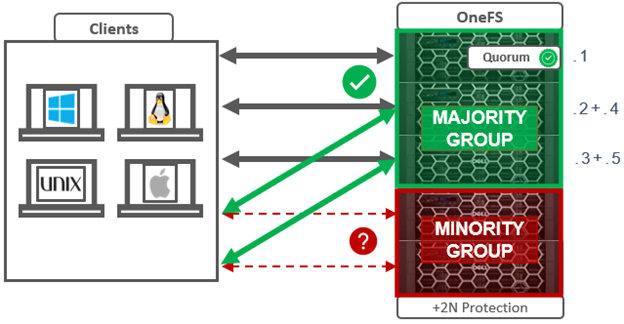
In order for a cluster to properly function and accept data writes, a quorum of nodes must be active and responding. A quorum is defined as a simple majority: a cluster with N nodes must have ⌊N/2⌋+1 nodes online in order to allow writes.

OneFS uses a quorum to prevent ‘split-brain’ conditions that can be introduced if the cluster should temporarily divide into two clusters. By following the quorum rule, the architecture guarantees that regardless of how many nodes fail or come back online, if a write takes place, it can be made consistent with any previous writes that have ever taken place.

Within OneFS, quorum is a property of the group management protocol (GMP) group which helps enforce consistency across node disconnects. As we saw in the previous article, since both nodes and drives in OneFS may be readable, but not writable, OneFS actually has two quorum properties:

Read quorum is represented by ‘efs.gmp.has_quorum’ and write quorum by ‘efs.gmp.has_super_block_quorum’. For example:

# sysctl efs.gmp.has_quorum

efs.gmp.has_quorum: 1

# sysctl efs.gmp.has_super_block_quorum

efs.gmp.has_super_block_quorum: 1

The value of ‘1’ for each of the above confirms that the cluster currently has both read and write quorum respectively.

In OneFS, a group is basically a list of nodes and drives which are currently participating in the cluster. Any nodes that are not in a cluster’s main quorum group form multiple groups.. As such, the main purpose of the OneFS Group Management Protocol (GMP) is to help create and maintain a group of synchronized nodes. Having a consistent view of the cluster state is critical, since initiators need to know which node and drives are available to write to, etc.

The group of nodes with quorum is referred to as the ‘majority side’. Conversely, any node group without quorum is termed a ‘minority side’.

There can only be one majority group, but there may be multiple minority groups. A group which has one or more components in a failed state is called ‘degraded’. The degraded property is frequently used as an optimization to avoid checking the capabilities of each component. The term ‘degraded’ is also used to refer to components without their maximum capabilities.

The following table lists and describes that various terminology associated with OneFS groups and quorum.

Term Definition
Degraded A group which has one or more components in a failed state is called ‘degraded’.
Dynamic Aspect The dynamic aspect refers to the state (and health) of nodes and drives which may change.
GMP Group Management Protocol, which helps create and maintain a group of synchronized nodes. Having a consistent view of the cluster state is critical, since initiators need to know which node and drives are available to write to, etc
Group A group is a given set of nodes which have synchronized state.
Majority side A group of nodes with quorum is referred to as the ‘majority side’. By definition, there can only be one majority group.
Minority side Any group of nodes without quorum is a ‘minority side’. There may be multiple minority groups.
Quorum group A group of nodes with quorum, referred to as the ‘majority side’
Static Aspect The static aspect is the composition of the cluster, which is stored in the array.xml file.

Under normal operating conditions, every node and its disks are part of the current group, which can be shown by running sysctl efs.gmp.group on any node of the cluster. For example, the complex group output from a 93 node cluster:

# sysctl efs.gmp.group

efs.gmp.group: <d70af9> (93) :{ 1-14:0-14, 15:0-13, 16-19:0-14, 20:0-13, 21-28,30-33:0-14, 34:0-4,6-10,12-14, 35-36:0-14, 37-48:0-19, 49-60:0-14, 61-62:0-13, 63-81:0-14, 82:0-7,9-14, 83-87:0-14, 88:0-13, 89-91:0-14, 92:0-1,3-14, down: 29, soft_failed: 29, read_only: 29, smb: 1-28,30-92, nfs: 1-28,30-92, swift: 1-28,30-92, all_enabled_protocols: 1-28,30-92, isi_cbind_d: 1-28,30-92, lsass: 1-28,30-92, s3: 1-28,30-92, external_connectivity: 1-28,30-92 }

As can be seen above, protocol and external network participation is also reported, in addition to the overall state of the nodes and drives in the group,.

For more verbose output, the efs.gmp.current_info sysctl yields extensive current GMP information.

# sysctl efs.gmp.current_info

So a quorum group, as reported by GMP, consists of two parts:

Group component Description
Sequence number Provides identification for the group
Membership list Describes the group

The sequence number in the example above is:  <d70af9>

Next, the membership list shows the group members within brackets. For example, { 1-4:0-14 … } represents a four node pool, with Array IDs 1 through 4. Each node contains 15 drives, numbered zero through 14.

  • The numbers before the colon in the group membership list represent the participating Array IDs.
  • The numbers after the colon represent Drive IDs.

Note that node IDs differ from Logical Node Numbers (LNNs), the node numbers that occur within node names, and displayed by isi stat.

GMP distributes a variety of state information about nodes and drives, from identifiers to usage statistics. The most fundamental of these is the composition of the cluster, or ‘static aspect’ of the group, which is stored in the array.xml file. The array.xml file also includes info such as the ID, GUID, and whether the node is diskless or storage, plus attributes not considered part of the static aspect, such as internal IP addresses.

Similarly, the state of a node’s drives is stored in the drives.xml file, along with a flag indicating whether the drive is an SSD. Whereas GMP manages node states directly, drive states are actually managed by the ‘drv’ module, and broadcast via GMP. A significant difference between nodes and drives is that for nodes, the static aspect is distributed to every node in the array.xml file, whereas drive state is only stored locally on a node. The array.xml information is needed by every node in order to define the cluster and allow nodes to form connections. In contrast, drives.xml is only stored locally on a node. When a node goes down, other nodes have no method to obtain the drive configuration of that node. Drive information may be cached by the GMP, but it is not available if that cache is cleared.

Conversely, ‘dynamic aspect’ refers to the state of nodes and drives which may change. These states indicate the health of nodes and their drives to the various file system modules – plus whether or not components can be used for particular operations. For example, a soft-failed node or drive should not be used for new allocations. These components can be in one of seven states:

Node State Description
Dead The component is not allowed to come back to the UP state and should be removed.
Down The component is not responding.
Gone The component has been removed.
Read-only This state only applies to nodes.
Soft-failed The component is in the process of being removed.
Stalled A drive is responding slowly.
Up The component is responding.

Note that a  node or drive may go from ‘down, soft-failed’ to ‘up, soft-failed’ and back. These flags are persistently stored in the array.xml file for nodes and the drives.xml file for drives.

Group and drive state information allows the various file system modules to make timely and accurate decisions about how they should utilize nodes and drives. For example, when reading a block, the selected mirror should be on a node and drive where a read can succeed (if possible). File system modules use the GMP to test for node and drive capabilities, which include:

Capability Description
Readable Drives on this node may be read.
Restripe From Move blocks away from the node.
Writable Drives on this node may be written to.

Access levels help define ‘as a last resort’ with states for which access should be avoided unless necessary. The access levels, in order of increased access, are as follows:

Access Level Description
Modify stalled Allows writing to stalled drives.
Never Indicates a group state never supports the capability.
Normal The default access level
Read soft-fail Allows reading from soft-failed nodes and drives.
Read stalled Allows reading from stalled drives.

Drive state and node state capabilities are shown in the following tables. As shown, the only group states affected by increasing access levels are soft-failed and stalled.


Minimum Access Level for Capabilities Per Node State

Node States Readable Writeable Restripe From
UP Normal Normal No
UP, Smartfail Soft-fail Never Yes
UP, Read-only Normal Never No
UP, Smartfail, Read-only Soft-fail Never Yes
DOWN Never Never No
DOWN, Smartfail Never Never Yes
DOWN, Read-only Never Never No
DOWN, Smartfail, Read-only Never Never Yes
DEAD Never Never Yes


Minimum Access Level for Capabilities Per Drive State

Drive States Minimum Access Level to Read Minimum Access Level to Write Restripe From
UP Normal Normal No
UP, Smartfail Soft-fail Never Yes
DOWN Never Never No
DOWN, Smartfail Never Never Yes
DEAD Never Never Yes
STALLED Read_Stalled Modify_Stalled No


OneFS depends on a consistent view of a cluster’s group state. For example, some decisions, such as choosing lock coordinators, are made assuming all nodes have the same coherent notion of the cluster.

Group changes originate from multiple sources, depending on the particular state. Drive group changes are initiated by the drv module. Service group changes are initiated by processes opening and closing service devices. Each group change creates a new group ID, comprising a node ID and a group serial number. This group ID can be used to quickly determine whether a cluster’s group has changed, and is invaluable for troubleshooting cluster issues, by identifying the history of group changes across the nodes’ log files.

GMP provides coherent cluster state transitions using a process similar to two-phase commit, with the up and down states for nodes being directly managed by the GMP. RBM or Remote Block Manager code provides the communication channel that connect devices in the OneFS. When a node mounts /ifs it initializes the RBM in order to connect to the other nodes in the cluster, and uses it to exchange GMP Info, negotiate locks, and access data on the other nodes.

When a group change occurs, a cluster-wide process writes a message describing the new group membership to /var/log/messages on every node. Similarly, if a cluster ‘splits’, the newly-formed sub-clusters behave in the same way: each node records its group membership to /var/log/messages. When a cluster splits, it breaks into multiple clusters (multiple groups). This is rarely, if ever, a desirable event. A cluster is defined by its group members. Nodes or drives which lose sight of other group members no longer belong to the same group and therefore no longer belong to the same cluster.

The ‘grep’ CLI utility can be used to view group changes from one node’s perspective, by searching /var/log/messages for the expression ‘new group’. This will extract the group change statements from the logfile. The output from this command may be lengthy, so can be piped to the ‘tail’ command to limit it the desired number of lines. For example, to get the last two group changes from the local node’s  log:

# grep -i 'new group' /var/log/messages | tail -n 2

2024-03-25T16:47:22.114319+00:00 <0.4> TME1-8(id8) /boot/kernel.amd64/kernel: [gmp_info.c:2690](pid 63964="kt: gmp-drive-updat")(tid=101253) new group: <d70aac> (93) { 1-14:0-14, 15:0-13, 16-19:0-14, 20:0-13, 21-28,30-33:0-14, 34:0-4,6-10,12-14, 35-36:0-14, 37-48:0-19, 49-60:0-14, 61-62:0-13, 63-81:0-14, 82:0-7,9-14, 83-87:0-14, 88:0-13, 89-91:0-14, 92:0-1,3-14, down: 29, read_only: 29 }

2024-03-26T15:34:57.131337+00:00 <0.4> TME1-8(id8) /boot/kernel.amd64/kernel: [gmp_info.c:2690](pid 88332="kt: gmp-config")(tid=101526) new group: <d70aed> (93) { 1-14:0-14, 15:0-13, 16-19:0-14, 20:0-13, 21-28,30-33:0-14, 34:0-4,6-10,12-14, 35-36:0-14, 37-48:0-19, 49-60:0-14, 61-62:0-13, 63-81:0-14, 82:0-7,9-14, 83-87:0-14, 88:0-13, 89-91:0-14, 92:0-1,3-14, down: 29, soft_failed: 29, read_only: 29 }