OneFS CELOG – Part 2

In the previous article in this series, we looked at an overview of CELOG – OneFS’ cluster event log and alerting infrastructure. For this blog post, we’ll  focus in on CELOG’s configuration and management.

CELOG’s CLI is integrated with OneFS’ RESTful platform API and roles-based access control (RBAC) and is based around the ‘isi event’ series of commands. These are divided into three main groups:

Command Group Description
Alerting Alerts:  Manage rules for reporting on groups of correlated events

Channels:  Manage channels for sending alerts

Monitoring and Control Events: List and view events

Groups: Manage groups of correlated event occurrences

Test:  Create test events

Configuration Settings:  Manage maintenance window, data retention and storage limits

The isi event alerts command set allow for the viewing, creation, deletion, and modification of alert conditions. These are the rules that specify how sets of event groups are reported.

As such, alert conditions combine a set of event groups or event group categories with a condition and a set of channels (isi event channels). When any of the specified event group conditions are met, an alert fires and is dispatched via the specified channel(s).

An alert condition comprises:

  • The threshold or condition under which alerts should be sent.
  • The event groups and/or categories it applies to (there is a special value ‘all’).
  • The channels through which alerts should be sent.

The channels must already exist and cannot be deleted while in use by any alert conditions. Some alert conditions have additional parameters, including: NEW, NEW_EVENTS, ONGOING, SEVERITY_INCREASE, SEVERITY_DECREASE and RESOLVED.

An alert condition may also possess a duration, or ‘transient period’. If this is configured, then no event group which is active (ie. not resolved) for less than this period of time will be reported upon via the alert condition that specifies it.

Note: The same event group may be reported upon under other alert conditions that do not specify a transient period or specify a different one.

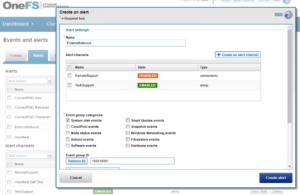
The following command creates an alert named ExternalNetwork, sets the alert condition to NEW, the source event group to ID 100010001 (SYS_DISK_VARFULL), the channel to TechSupport, sets the severity level to critical, and the maximum alert limit to 5:

# isi event alerts create ExternalNetwork NEW –add_eventgroup 100010001 --channel TechSupport --severity critical --limit 5

Or, from the WebUI by browsing to Cluster Management > Events and Alerts > Alerts:

Similarly, the following will add the event group ID 123456 to the ExternalNetwork alert, and only send alerts for event groups with critical severity:

# isi event alerts modify ExternalNetwork -–add-eventgroup 123456 --severity critical

Channels are the routes via which alerts are sent, and include any necessary routing, addressing, node exclusion information, etc. The isi event channels command provides create, modify, delete, list and view options for channels.

The supported communication methods include:

  • SMTP
  • SNMPA
  • ConnectEMC

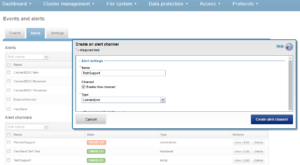
The following command creates the channel ‘TechSupport’ used in the example above, and sets its type to EMCConnect:

# isi event channels create TechSupport connectemc

Note that ESRS connectivity must be enabled prior to configuring a ‘connectemc’ channel.

Conversely, a channel can easily be removed with the following syntax:

# isi event channels delete TechSupport

Or from the WebUI by browsing to Cluster Management > Events and Alerts > Alerts:

For SMTP, a valid email server is required. This can be checked with the ‘isi email view’ command. If the “SMTP relay address” field is empty, this can be configured by running something along the lines of:

# isi email settings modify -–mail-relay=mail.mycompany.com

The following syntax modifies the channel named TechSupport, changing the SMTP username to admin, and resetting the SMTP password:

# isi event channels modify TechSupport --smtp-username admin -–smtp-password p@ssw0rd

SNMP traps are sent by running either ‘snmpinform’ or ‘snmptrap’ with appropriate parameters (agent, community, etc). To configure a cluster to send SNMP traps in order for a network monitoring system (NMS) to receive them, from the WebUI navigate to Dashboard > Events > Notification Rules > Add Rule and create a rule with Recipients = SNMP, and enter the correct values for ‘Community’ and ‘Host’ appropriate for your NMS.

The isi event events list command displays events with their ID, time of occurrence, severity, logical node number, event group and message. The events for a single event group occurrence can be listed using the –eventgroup-id parameter.

To identify the instance ID of the event that you want to view, run the following command:

# isi event events list

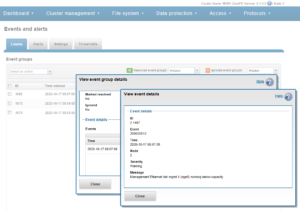
To view the details of a specific event, run the isi event events view command and specify the event instance ID. The following displays the details for an event with the instance ID of 6.201114:

# isi event events view 6.201114

           ID: 6.201114

Eventgroup ID: 4458074

   Event Type: 400040017

      Message: (policy name: cb-policy target: 10.245.109.130) SyncIQ encountered a filesystem error. Failure due to file system error(s): Could not sync stub file 103f40aa8: Input/output error

        Devid: 6

          Lnn: 6

         Time: 2020-10-26T12:23:14

     Severity: warning

        Value: 0.0

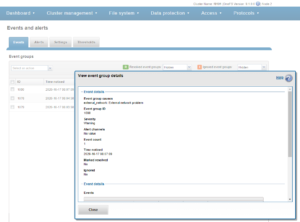
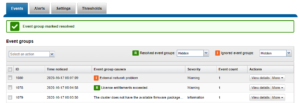
The list of event groups can be filtered by cause, begin (occurred after this time), end (occurred before this time), resolved, ignored or event count (event group occurrences with at least as many events as specified). By default only event group occurrences which are not ignored will be shown.

The configurations options are to set or revert the ignore status and to set the resolved status. Be warned that an event group marked as resolved cannot be reverted.

For example, the following example command modifies event group ID 10 to a status ‘ignored’:

# isi event groups modify 10 --ignored true

Note: If desired, the isi event group bulk command will set all event group occurrences to either ignore or resolved. Use sparingly!

The isi events settings view command displays the current values of all settings, whereas the modify command allows any of them to be reconfigured.

The configurable options include:

Config Option Detail
retention-days Retention period for data concerning resolved event groups in days
storage-limit The amount of cluster storage that CELOG is allowed to consume – measured in millionths of the total on the cluster (megabytes per terabyte of total storage). Values of 1-100 are allowed (up to one ten thousandth of the total storage), however there is a 1GB floor for small clusters.
maintenance-start

maintenance-duration

These two should always be used together to specify a maintenance period during which no alerts will be generated. This is intended to suppress alerts during periods of maintenance when they are likely to be false alarms.
heartbeat-interval CELOG runs a periodic (once daily, by default) self test by sending a heartbeat event from each node which is reported via the system ‘Heartbeat Self-Test’ channel. Any failures are logged in /var/log/messages.

The following syntax alters the number of days that resolved event groups are saved to 90, and increases the storage limit for event data to 5MB for every 1TB of total cluster storage:

# isi event settings modify --retention-days 90 --storage-limit 5

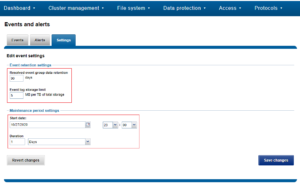
A maintenance window can be configured to discontinue alerts while performing maintenance on your cluster.

For example, the following command schedules a maintenance window that starts at 11pm on October 27, 2020, and lasts for one day:

# isi event settings modify --maintenance-start 2020-10-27T23:00:00 --maintenance-duration 1D

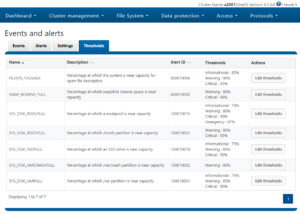
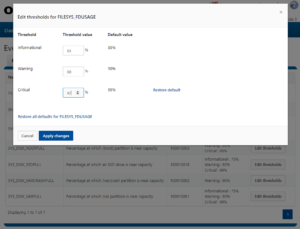
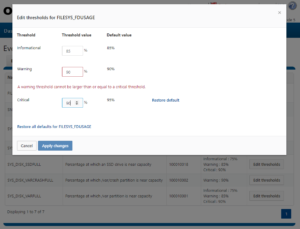
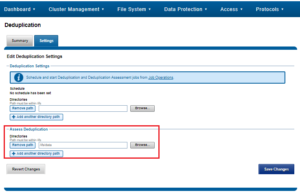
Maintenance periods and retention settings can also be configured from the WebUI by browsing to Cluster Management > Events and Alerts > Settings:

The isi event test command is provided in order to validate the communication path and confirm that events are getting transmitted correctly. The following generates a test alert with the message “Test msg from OneFS”:

# isi event test create "Test msg from OneFS"

Here are the log files that CELOG uses for its various purposes:

Log File Description
/var/log/isi_celog_monitor.log System monitoring and event creation
/var/log/isi_celog_capture.log First stop recording of events, attachment generation
/var/log/isi_celog_analysis.log Assignment of events to eventgroups
/var/log/isi_celog_reporting.log Evaluation of alert conditions and sending of alert requests
/var/log/isi_celog_alerting.log Sending of alerts
/var/log/messages Heartbeat failures
/ifs/.ifsvar/db/celog_alerting/<channel>/fail.log Failure messages from alert sending
/ifs/.ifsvar/db/celog_alerting/<channel>/sent.log Alerts sent via <channel>

These logs can be invaluable for troubleshooting the various components of OneFS events and alerting.

As mentioned previously, CELOG combines multiple events into a single event group. This allows an incident to be communicated and managed as a single, coherent issue. A similar process occurs for multiple instances of the same event. As such, the following deduplication rules apply to these broad categories of events, namely:

Event Category Descriptions
Repeating Events Events firing repeatedly before the elapsed time-out value will be condensed into a “… is triggering often” event
Sensor Multiple events by hardware sensors on a node within a given time-frame will be combined as a “hardware problems” event
Disk Multiple events generated by a specific disk will be coalesced into a logical “disk problems” event
Network Various issues may exist, depending on the type of connectivity problem between nodes of a cluster:

§  When a node cannot contact any other nodes in the cluster, each of its connection errors will be condensed into a “node cannot contact cluster” event.

§  When a node is not reachable by the rest of the cluster nodes, cluster will combine the connection errors as a “cluster cannot reach node X event

§  When clusters split into chunks, each set of nodes will report connection errors coalesced as a “nodes X, Y, Z cannot contact nodes A, B, C event.

§  When cluster re-forms, events will again be combined into a single logical “cluster split into N groups: { A, B, C }, { X, Y, Z }, …” event.

§  When connectivity between all nodes is restored and cluster is reformed, the events will be condensed into a single “All nodes lost internal connectivity” event.

Reboot


If a node is unreachable even after a defined time elapses after a reboot, further connection errors will be coalesced as a “node did not rejoin cluster after reboot” event.

So CELOG is your cluster guardian – continuously monitoring the health and performance of the hardware, software, and services – and generating events when situations occur that might require your attention.

OneFS CELOG

The previous post about customizable CELOG alerts generated a number of questions from the field. So, over the course of the next couple of articles we’ll be reviewing the fundamentals of OneFS logging and alerting.

The OneFS Cluster Event Log (or CELOG) provides a single source for the logging of events that occur in an Isilon cluster. Events are used to communicate a picture of cluster health for various components. CELOG provides a single point from which notifications about the events are generated, including sending alert emails and SNMP traps.

Cluster events can be easily viewed from the WebUI by browsing to Cluster Management > Events and Alerts > Events. For example:

Or from the CLI, using the ‘isi event events view’ syntax:

# isi event events view 2.370158

           ID: 2.370158

Eventgroup ID: 271428

   Event Type: 600010001

      Message: The snapshot daemon failed to create snapshot 'Hourly - prod' in schedule 'Hourly @ Every Day': error: Name collision

        Devid: 2

          Lnn: 2

         Time: 2020-10-19T17:01:33

     Severity: warning

        Value: 0.0

In this instance, CELOG communicates on behalf of SnapshotIQ that it’s failed to create a scheduled hourly snapshot because of an issue with the naming convention.

At a high level, processes that monitor conditions on the cluster or log important events during the course of their operation communicate directly with the CELOG system. CELOG receives event messages from other processes via a well-defined API.

A CELOG event often contains the following elements:

Element Definition
Event Events are generated by the system and may be communicated in various ways (email, snmp traps, etc), depending upon the configuration.
Specifier Specifiers are strings containing extra information, which can be used to coalesce events and construct meaningful, readable messages.
Attachment Extra chunks of information, such as parts of log files or sysctl output, added to email notifications to provide additional context about an event.

For example, in SnapshotIQ event above, we can see the event text contains a specifier and attachment that has been mostly derived from the corresponding syslog message:

# grep "Hourly - prod" /var/log/messages* | grep "2020-10-19T17:01:33"

2020-10-19T17:01:33-04:00 <3.3> a200-2 isi_snapshot_d[5631]: create_schedule_snapshot: snapshot schedule (Hourly @ Every Day) pattern created a snapshot name collision (Hourly - prod); scheduled create failed.

CELOG is a large, complex system, which can be envisioned as a large pipeline. It gathers events and statistics info on one end from isi_stats_d and isi_celog_monitor, plus directly other applications such as SmartQuotas, SyncIQ, etc. These events are passed from one functional block to another, with a database at the end of the pipe. Along the way, attachments may be generated, notifications sent, and events passed to a coalescer.

On the front end, there are two dispatchers, which pass communication from the UNIX socket and network to their corresponding handlers. As events are processed, they pass through a series of coalescers. At any point they may be intercepted by the appropriate coalescer, which creates a coalescing event and which will accept other related events.

As events drop out the bottom of the coalescer stack, they’re deposited in add, modify and delete queues in the backend database infrastructure. The coalescer thread then moves onto pushing things into the local database, forwarding them along to the primary coalescer, and queueing events to have notifications sent and/or attachments generated.

The processes of safely storing events, analyzing them, deciding on what alerts to send and sending them is separated into four separate modules within the pipeline:

The following table provides a description of each of these CELOG modules:

Module Definition
Capture The first stage in the processing pipeline, Event Capture is responsible for reading event occurrences from the kernel queue, storing them safely on persistent local storage, generating attachments, and queueing them by priority for analysis.
Analysis Extra chunks of information (log file extracts, sysctl output, etc) are added to alert notifications to provide additional context about an event.
Reporter The Reporter is the third stage in the processing pipeline, and runs on only one node in the cluster. It periodically queries Event Analysis for changes and generates alert requests for any relevant conditions.
Alerter The Alerter is the final stage in the processing pipeline, responsible for actually delivering the alerts requested by the reporter. There is a single sender for each enabled channel on the cluster.

CELOG local and backend database redundancy ensures reliable event storage and guards against bottlenecks.

By default, OneFS provides the following event group categories, each of which contain a variety of conditions, or ‘event group causes’, which will trigger an event if their conditions are met:

Event Group Category Event Series Number
System disk events 1000*****
Node status events 2000*****
Reboot events 3000*****
Software events 4000*****
Quota events 5000*****
Snapshot events 6000*****
Windows networking events 7000*****
Filesystem events 8000*****
Hardware events 9000*****
CloudPools events 11000*****

Say, for example a chassis fan fails in one of a cluster’s nodes. OneFS will likely capture multiple hardware events. For instance:

  • Event # 90006003 related to the physical power supply
  • Event # 90020026 for an over-temperature alert

All the events relating to the fan failure will be represented in a single event group, which allows the incident to be communicated and managed as a single, coherent issue.

Detail on individual events can be viewed for each item. For example, the following event is for a drive firmware incompatibility.

Drilling down into the event details reveals the event number – in this case, event # 100010027:

OneFS events and alerts info is available online at the CELOG event reference guide.

The Event Help information will often provide an “Administrator Action” plan, which, where appropriate, provides troubleshooting and/or resolution steps for the issue.

For example, here’s the Event Help for snapshot delete failure event # 600010002:

The OneFS WebUI Cluster Status dashboard shows the event group info at the bottom of the page.

More detail and configuration can be found in the Events and Alerts section of the Cluster Management WebUI. This can be accessed via the “Manage event groups” link, or by browsing to Cluster Management > Events and Alerts > Events.

OneFS Customizable CELOG Alerts

Another feature enhancement that is introduced in the new OneFS 9.1 release is customizable CELOG event thresholds. This new functionality allows cluster administrators to customize the alerting thresholds for several filesystem capacity-based events. These new configurable events and their default threshold values include:

These event thresholds can be easily set from the OneFS WebUI, CLI, or platform API. For configuration via the WebUI, browse to Cluster Management > Events and Alerts > Thresholds, as follows:

The desired event can be configured from the OneFS WebUI by clicking on the associated ‘Edit Thresholds’ button. For example, to lower the thresholds for the FILESYS_FDUSAGE event critical threshold from 95 to 92%:

Note that none of an event’s thresholds can have an equal value to each other. Plus an informational must be lower than warning and critical must be higher than warning. For example:

Alternatively, event threshold configuration can also be performed via the OneFS CLI ‘isi event thresholds’ command set . For example:

The list of configurable CELOG events can be displayed with the following CLI command:

# isi event threshold list
ID ID Name
-------------------------------
100010001 SYS_DISK_VARFULL
100010002 SYS_DISK_VARCRASHFULL
100010003 SYS_DISK_ROOTFULL
100010015 SYS_DISK_POOLFULL
100010018 SYS_DISK_SSDFULL
600010005 SNAP_RESERVE_FULL
800010006 FILESYS_FDUSAGE
-------------------------------

Full details, including the thresholds, are shown with the addition of the ‘-v’ verbose flag:

# isi event threshold list -v
ID: 100010001
ID Name: SYS_DISK_VARFULL
Description: Percentage at which /var partition is near capacity
Defaults: info (75%), warn (85%), crit (90%)
Thresholds: info (75%), warn (85%), crit (90%)
--------------------------------------------------------------------------------
ID: 100010002
ID Name: SYS_DISK_VARCRASHFULL
Description: Percentage at which /var/crash partition is near capacity
Defaults: warn (90%)
Thresholds: warn (90%)
--------------------------------------------------------------------------------
ID: 100010003
ID Name: SYS_DISK_ROOTFULL
Description: Percentage at which /(root) partition is near capacity
Defaults: warn (90%), crit (95%)
Thresholds: warn (90%), crit (95%)
--------------------------------------------------------------------------------
ID: 100010015
ID Name: SYS_DISK_POOLFULL
Description: Percentage at which a nodepool is near capacity
Defaults: info (70%), warn (80%), crit (90%), emerg (97%)
Thresholds: info (70%), warn (80%), crit (90%), emerg (97%)
--------------------------------------------------------------------------------
ID: 100010018
ID Name: SYS_DISK_SSDFULL
Description: Percentage at which an SSD drive is near capacity
Defaults: info (75%), warn (85%), crit (90%)
Thresholds: info (75%), warn (85%), crit (90%)
--------------------------------------------------------------------------------
ID: 600010005
ID Name: SNAP_RESERVE_FULL
Description: Percentage at which snapshot reserve space is near capacity
Defaults: warn (90%), crit (99%)
Thresholds: warn (90%), crit (99%)
--------------------------------------------------------------------------------
ID: 800010006
ID Name: FILESYS_FDUSAGE
Description: Percentage at which the system is near capacity for open file descriptors
Defaults: info (85%), warn (90%), crit (95%)
Thresholds: info (85%), warn (90%), crit (95%)

Similarly, the following CLI syntax can be used to display the existing thresholds for a particular event – in this case the SYS_DISK_VARFULL /var partition full alert:

# isi event thresholds view 100010001

         ID: 100010001

    ID Name: SYS_DISK_VARFULL

Description: Percentage at which /var partition is near capacity

   Defaults: info (75%), warn (85%), crit (90%)

 Thresholds: info (75%), warn (85%), crit (90%)

The following command will reconfigure the threshold from the defaults of 75%|85%|95% to 70%|75%|85%:

# isi event thresholds modify 100010001 --info 70 --warn 75 --crit 85

# isi event thresholds view 100010001

         ID: 100010001

    ID Name: SYS_DISK_VARFULL

Description: Percentage at which /var partition is near capacity

   Defaults: info (75%), warn (85%), crit (90%)

 Thresholds: info (70%), warn (75%), crit (85%)

And finally, to reset the thresholds back to their default values:

#  isi event thresholds reset 100010001

Are you sure you want to reset info, warn, crit from event 100010001?? (yes/[no]): yes

# isi event thresholds view 100010001

         ID: 100010001

    ID Name: SYS_DISK_VARFULL

Description: Percentage at which /var partition is near capacity

   Defaults: info (75%), warn (85%), crit (90%)

 Thresholds: info (75%), warn (85%), crit (90%)

Configuring OneFS SyncIQ Encryption

Unlike previous OneFS versions, SyncIQ is disabled by default in OneFS 9.1 and later. Once SyncIQ has been enabled by the cluster admin, a global encryption flag is automatically set, requiring all SyncIQ policies to be encrypted. Similarly, when upgrading a PowerScale cluster to OneFS 9.1, the global encryption flag is also set. However, be aware that the global encryption flag is not enabled on clusters configured with any existing SyncIQ policies upon upgrade to OneFS 9.1 or later releases.

The following procedure can be used to configure SyncIQ encryption from the OneFS CLI:

  1. Ensure both source and target clusters are running OneFS 8.2 or later.
  2. Next, create an X.509 certificates, one for each of the source and target clusters, and signed by a certificate authority.
Certificate Type Abbreviation
Certificate Authority <ca_cert_id>
Source Cluster Certificate <src_cert_id>
Target Cluster Certificate <tgt_cert_id>

These can be generated using publicly available tools, such as OpenSSL: http://slproweb.com/products/Win32OpenSSL.html.

  1. Add the newly created certificates to the appropriate source cluster stores. Each cluster gets certificate authority, its own certificate, and its peer’s certificate:
# isi sync certificates server import <src_cert_id> <src_key>

# isi sync certificates peer import <tgt_cert_id>

# isi cert authority import <ca_cert_id>
  1. On the source cluster, set the SyncIQ cluster certificate:
# isi sync settings modify --cluster-certificate-id=<src_cert_id>
  1. Add the certificates to the appropriate target cluster stores:
# isi sync certificates server import <tgt_cert_id> <tgt_key>

# isi sync certificates peer import <src_cert_id>

# isi cert authority import <ca_cert_id>
  1. On the target cluster, set the SyncIQ cluster certificate:
# isi sync settings modify --cluster-certificate-id=<tgt_cert_id>
  1. A global option is available in OneFS 9.1, requiring that all incoming and outgoing SyncIQ policies are encrypted. Be aware that executing this command impacts any existing SyncIQ policies that may not have encryption enabled. Only execute this command once all existing policies have encryption enabled. Otherwise, existing policies that do not have encryption enabled will fail. To enable this, execute the following command:
# isi sync settings modify --encryption-required=True
  1. On the source cluster, create an encrypted SyncIQ policy:
# isi sync policies create <pol_name> sync <src_dir> <target_ip> <tgt_dir> --target-certificate-id=<tgt_cert_id>

Or modify an existing policy on the source cluster:

# isi sync policies modify <pol_name> --target-certificate-id=<tgt_cert_id>

OneFS 9.1 also facilitates SyncIQ encryption configuration via the OneFS WebUI, in addition to CLI. For the source, server certificates can be added and managed by navigating to Data Protection > SyncIQ > Settlings and clicking on the ‘add certificate’ button:

And certificates can be imported onto the target cluster by browsing to Data Protection > SyncIQ > Certificates and clicking on the ‘add certificate’ button. For example:

So that’s what’s required to get encryption configured across a pair of clusters. There are several addition optional encryption configuration parameters available. These include:

  • Updating the policy to use a specified SSL cipher suite:
# isi sync policies modify <pol_name> --encryption-cipher-list=<suite>
  • Configuring the target cluster to check the revocation status of incoming certificates:
# isi sync settings modify --ocsp-address=<address> --ocsp-issuer-certificate-id=<ca_cert_id>
  • Modifying how frequently encrypted connections are renegotiated on a cluster:
# isi sync settings modify --renegotiation-period=24H
  • Requiring that all incoming and outgoing SyncIQ policies are encrypted:
# isi sync settings modify --encryption-required=True

To troubleshoot SyncIQ encryption, first check the reports for the SyncIQ policy in question. The reason for the failure should be indicated in the report. If the issue was due to a TLS authentication failure, then the error message from the TLS library will also be provided in the report. Also, more detailed information can often be found in /var/log/messages on the source and target clusters, including:

  • ID of the certificate that caused the failure.
  • Subject name of the certificate that caused the failure.
  • Depth at which the failure occurred in the certificate chain.
  • Error code and reason for the failure.

Before enabling SyncIQ encryption, be aware of the potential performance implications. While encryption only adds minimal overhead to the transmission, it may still negatively impact a production workflow. Be sure to test encrypted replication in a lab environment that emulates the environment before deploying in production.

Note that both the source and target cluster must be upgraded and committed to OneFS 8.2 or later, prior to configuring SyncIQ encryption.

In the event that SyncIQ encryption needs to be disabled, be aware that this can only be performed via the CLI and not the WebUI:

# isi sync settings modify --encryption-required=false

If encryption is disabled under OneFS 9.1, the following warnings will be displayed on creating a SyncIQ policy.

From the WebUI:

And via the CLI:

# isi sync policies create pol2 sync /ifs/data 192.168.1.2 /ifs/data/pol1

********************************************

WARNING: Creating a policy without encryption is dangerous.

Are you sure you want to create a SyncIQ policy without setting encryption?

Your data could be vulnerable without encrypted protection.

Type ‘confirm create policy’ to proceed.  Press enter to cancel:

OneFS SyncIQ and Encrypted Replication

Introduced in OneFS 9.1, SyncIQ encryption is integral in protecting data in-flight during inter-cluster replication over the WAN. This helps prevent man-in-the-middle attacks,  mitigating remote replication security concerns and risks.

SyncIQ encryption helps to secure data transfer between OneFS clusters, benefiting customers who undergo regular security audits and/or government regulations.

  • SyncIQ policies support end-to-end encryption for cross-cluster communications.
  • Certificates are easy to manage with the SyncIQ certificate store.
  • Certificate revocation is supported through the use of an external OCSP responder.
  • Clusters now require that all incoming and outgoing SyncIQ policies be encrypted through a simple configuration change in the SyncIQ global settings.

SyncIQ encryption relies on cryptography, using a public and private key pair to encrypt and decrypt replication sessions. These keys are mathematically related: Data encrypted with one key is decrypted with other key, confirming the identity of each cluster. SyncIQ uses the common X.509 Public Key Infrastructure (PKI) standard which defines certificate requirements.

A Certificate Authority (CA) serves as a trusted 3rd party, which issues and revokes certificates. Each cluster’s certificate store has the CA, it’s certificate, and the peer’s certificate, establishing a trusted ‘passport’ mechanism.

A SyncIQ job can attempt either an encrypted or unencrypted handshake:

Under the hood, SyncIQ utilizes TLS protocol version 1.2 and OpenSSL version: 1.0.2o. Customers are responsible for creating their own X.509 certificates, and SyncIQ peers must store each other’s end entity certificates. A TLS authentication failure will cause the corresponding SyncIQ job to immediately fail, and a CELOG event notifies the user of a SyncIQ encryption failure.

One the source cluster, the SyncIQ job’s coordinator process passes the target cluster’s public cert to its primary worker (pworker) process. The target monitor and sworker threads receive a list of approved source cluster certs. The pworkers can then establish secure connections with their corresponding sworkers (secondary workers).

SyncIQ traffic encryption is enabled on a per-policy basis. The CLI includes the ‘isi certificates’ and ‘isi sync certificates’ commands for the configuration of TLS certificates:

# isi cert -h

Description:

    Configure cluster TLS certificates.

Required Privileges:

    ISI_PRIV_CERTIFICATE

Usage:

    isi certificate <subcommand>

        [--timeout <integer>]

        [{--help | -h}]

Subcommands:

  Certificate Management:

    authority    Configure cluster TLS certificate authorities.

    server       Configure cluster TLS server certificates.

    settings     Configure cluster TLS certificate settings.

The following policy configuration fields are included:

Config Field Detail
–target-certificate-id <string> The ID of the target cluster certificate being used for encryption.
–ocsp_issuer_certificate-id <string> The ID of the certificate authority that issued the certificate whose revocation status is being checked.
–ocsp-address <string> The address of the OCSP responder to which to connect.
–encryption-cipher-list <string> The cipher list being used with encryption. For SyncIQ targets, this list serves as a list of supported ciphers. For SyncIQ sources, the list of ciphers will be attempted to be used in order.

In order to configure a policy for encryption the ‘–target-certificate-id’ must be specified. The users will input the ID of the desired certificate as is defined in the certificate manager. If self-signed certificates are being utilized, then they will have been manually copied to their peer cluster’s certificate store.

For authentication, there is a strict comparison of the public certs to the expected values. If a cert chain (that has been signed by the CA) is selected to authenticate the connection, the chain of certificates will need to be added to the cluster’s certificate authority store. Both methods use the ‘SSL VERIFY FAIL IF NO PEER CERT’ option when establishing the SSL context. Note that once encryption is enabled (by setting the appropriate policy fields), modification of the certificate IDs is allowed. However, removal and reverting to unencrypted syncs will prompt for confirmation before proceeding.

We’ll take a look at the SyncIQ encryption configuration procedures and options in the second article of this series.

OneFS Fast Reboots

As part of engineering’s on-going PowerScale ‘always-on’ initiative, OneFS offers a fast reboot service, that focuses on decreasing the duration, and lessening the impact, of planned node reboots on clients. It does this by automatically reducing the size of the lock cache on all nodes before a group change event.

By shortening group change window times, this new faster reboot service will be extremely advantageous to cluster upgrades and planned shutdowns, by helping to alleviate the window of unavailability for clients connected to a rebooting node.

The fast reboot service is automatically enabled on installation or upgrade to OneFS 9.1, and it requires no further configuration. However, be aware that it will only begin to apply for upgrades, when moving from 9.1 to a future release.

Under the hood, this feature works by proactively de-staging all the lock management work, and removing it from the client latency path. This means that the time taken during group change activity – handling the locks, negotiating which coordinator has which lock, etc – is moved to an earlier window of time in the process. So, for example, for a planned cluster reboot or shutdown, instead of doing a lock dance during the group change window, the lazy lock queue is proactively drained for a period of up to 5 minutes, in order to move that activity to earlier in the process. This directly benefits OneFS upgrades, by shrinking the time for the actual group change. For a typical size cluster, this is reduced to approximately 1 second – down from around 17 seconds in prior releases. And engineering have been testing this feature with up to 5 million locks per domain.

There are several useful new and updated sysctls that indicate the status of the reboot service.

Firstly, efs.gmp.group has been enhanced to include both reboot and draining fields, that confirm which node(s) the reboot service is active on, and whether locks are being drained:

# sysctl efs.gmp.group efs.gmp.group: <35baa7> (3) :{ 1-3:0-5, nfs: 3, isi_cbind_d: 1-3, lsass: 1-3, drain: 1, reboot: 1 }

To complement this, the lki_draining sysctl confirms whether draining is still occurring:

# sysctl efs.lk.lki_draining

efs.lk.lki_draining: 1

OneFS has around 20 different lock domains, each with its own queue. These queues each contain lazy locks, which are locks that are not currently in use, but are just being held by the node in case it needs to use them again.

The stats from the various lock domain queues are aggregated, and displayed as a current total by the lazy_queue_size  sysctl:

# sysctl efs.lk.lazy_queue_size

efs.lk.lazy_queue_size: 460658

And finally, to indicates whether any of the lazy queues are above their reboot threshold:

# sysctl efs.lk.lazy_queue_above_reboot

efs.lk.lazy_queue_above_reboot: 0

In addition to the sysctls, and to aid with troubleshooting and debugging, the reboot service writes its status information about the locks being drained, etc, to /var/log/isi_shutdown.log.

As we can see in the first example, the node has activated the reboot service and is waiting for the lazy queues to be drained. And these messages are printed every 60 seconds until complete.

Once done, a log message is then written confirming that the lazy queues have been drained, and that the node is about to reboot or shutdown.

So there you have it – the new faster reboot service and low-impact group changes, completing the next milestone in the OneFS ‘always on’ journey.

Introducing OneFS 9.1

Dell PowerScale OneFS version 9.1 has been released and is now generally available for download and cluster installation and upgrade.

This new OneFS 9.1 release embraces the PowerScale tenants of simplified management, increased performance, and extended flexibility, and introduces the following new features:

  • CAVA-based anti-virus support
  • Granular configuration of node and cluster-level Event and alerting
  • Improved restart of backups for better RTO and RPO
  • Faster performance for access to CloudPools tiered files
  • Faster detection and resolution of node or resource unavailability
  • Flexible audit configuration for compliance and business needs
  • Encryption of replication traffic for increased security
  • Simplified in-product license activation for clusters connected via SRS

We’ll be looking more closely at this new OneFS 9.1 functionality in forthcoming blog articles.

OneFS SmartDedupe – Assessment & Estimation

To complement the actual SmartDedupe job, a dry-run Dedupe Assessment job is also provided to help estimate the amount of space savings that will be seen by running deduplication on a particular directory or set of directories. The dedupe assessment job reports a total potential space savings. The dedupe assessment does not differentiate the case of a fresh run from the case where a previous dedupe job has already done some sharing on the files in that directory. The assessment job does not provide the incremental differences between instances of this job. Isilon recommends that the user should run the assessment job once on a specific directory prior to starting an actual dedupe job on that directory.

The assessment job runs similarly to the actual dedupe job, but uses a separate configuration. It also does not require a product license and can be run prior to purchasing SmartDedupe in order to determine whether deduplication is appropriate for a particular data set or environment. This can be configured from the WebUI by browsing to File System > Deduplication > Settings and adding the desired directories(s) in the ‘Assess Deduplication’ section.


Alternatively, the following CLI syntax will achieve the same result:

# isi dedupe settings modify –add-assess-paths /ifs/data

Once the assessment paths are configured, the job can be run from either the CLI or WebUI. For example:

Or, from the CLI:

# isi job types list | grep –I assess

DedupeAssessment   Yes      LOW  

# isi job jobs start DedupeAssessment

Once the job is running, it’s progress and be viewed by first listing the job to determine it’s job ID.

# isi job jobs list

ID   Type             State   Impact  Pri  Phase  Running Time

---------------------------------------------------------------

919  DedupeAssessment Running Low     6    1/1    -

---------------------------------------------------------------

Total: 1

And then viewing the job ID as follows:

# isi job jobs view 919

               ID: 919

             Type: DedupeAssessment

            State: Running

           Impact: Low

           Policy: LOW

              Pri: 6

            Phase: 1/1

       Start Time: 2019-01-21T21:59:26

     Running Time: 35s

     Participants: 1, 2, 3

         Progress: Iteration 1, scanning files, scanned 61 files, 9 directories, 4343277 blocks, skipped 304 files, sampled 271976 blocks, deduped 0 blocks, with 0 errors and 0 unsuccessful dedupe attempts

Waiting on job ID: -

      Description: /ifs/data

The running job can also be controlled and monitored from the WebUI:

Under the hood, the dedupe assessment job uses a separate index table from the actual dedupe process. Plus, for the sake of efficiency, the assessment job also samples fewer candidate blocks than the main dedupe job, and obviously does not actually perform deduplication. This means that, often, the assessment will provide a slightly conservative estimate of the actually deduplication efficiency that’s likely to be achieved.

Using the sampling and consolidation statistics, the assessment job provides a report which estimates the total dedupe space savings in bytes. This can be viewed for the CLI using the following syntax:

# isi dedupe reports view 919

    Time: 2020-09-21T22:02:18

  Job ID: 919

Job Type: DedupeAssessment

 Reports

        Time: 2020-09-21T22:02:18

     Results:

Dedupe job report:{

    Start time = 2020-Sep-21:21:59:26

    End time = 2020-Sep-21:22:02:15

    Iteration count = 2

    Scanned blocks = 9567123

    Sampled blocks = 383998

    Deduped blocks = 2662717

    Dedupe percent = 27.832

    Created dedupe requests = 134004

    Successful dedupe requests = 134004

    Unsuccessful dedupe requests = 0

    Skipped files = 328

    Index entries = 249992

    Index lookup attempts = 249993

    Index lookup hits = 1

}

Elapsed time:                      169 seconds

Aborts:                              0

Errors:                              0

Scanned files:                      69

Directories:                        12

1 path:

/ifs/data

CPU usage:                         max 81% (dev 1), min 0% (dev 2), avg 17%

Virtual memory size:               max 341652K (dev 1), min 297968K (dev 2), avg 312344K

Resident memory size:              max 45552K (dev 1), min 21932K (dev 3), avg 27519K

Read:                              0 ops, 0 bytes (0.0M)

Write:                             4006510 ops, 32752225280 bytes (31235.0M)

Other jobs read:                   0 ops, 0 bytes (0.0M)

Other jobs write:                  41325 ops, 199626240 bytes (190.4M)

Non-JE read:                       1 ops, 8192 bytes (0.0M)

Non-JE write:                      22175 ops, 174069760 bytes (166.0M)

Or from the WebUI, by browsing to Cluster Management > Job Operations > Job Types:

As indicated, the assessment report for job # 919 in this case discovered the potential of 27.8% in data savings from deduplication.

Note that the SmartDedupe dry-run estimation job can be run without any licensing requirements, allowing an assessment of the potential space savings that a dataset might yield before making the decision to purchase the full product.

OneFS SmartDedupe – Performance Considerations

As with many things in life, deduplication is a compromise. In order to gain increased levels of storage efficiency, additional cluster resources (CPU, memory and disk IO) are utilized to find and execute the sharing of common data blocks.

Another important performance impact consideration with dedupe is the potential for data fragmentation. After deduplication, files that previously enjoyed contiguous on-disk layout will often have chunks spread across less optimal file system regions. This can lead to slightly increased latencies when accessing these files directly from disk, rather than from cache.

To help reduce this risk, SmartDedupe will not share blocks across node pools or data tiers, and will not attempt to deduplicate files smaller than 32KB in size. On the other end of the spectrum, the largest contiguous region that will be matched is 4MB.

Because deduplication is a data efficiency product rather than performance enhancing tool, in most cases the consideration will be around cluster impact management. This is from both the client data access performance front, since, by design, multiple files will be sharing common data blocks, and also from the dedupe job execution perspective, as additional cluster resources are consumed to detect and share commonality.

The first deduplication job run will often take a substantial amount of time to run, since it must scan all files under the specified directories to generate the initial index and then create the appropriate shadow stores. However, deduplication job performance will typically improve significantly on the second and subsequent job runs (incrementals), once the initial index and the bulk of the shadow stores have already been created.

If incremental deduplication jobs do take a long time to complete, this is most likely indicative of a data set with a high rate of change. If a deduplication job is paused or interrupted, it will automatically resume the scanning process from where it left off.

As mentioned previously, deduplication is a long running process that involves multiple job phases that are run iteratively. SmartDedupe typically processes around 1TB of data per day, per node.

Deduplication can significantly increase the storage efficiency of data. However, the actual space savings will vary depending on the specific attributes of the data itself. As mentioned above, the deduplication assessment job can be run to help predict the likely space savings that deduplication would provide on a given data set.

For example, virtual machines files often contain duplicate data, much of which is rarely modified. Deduplicating similar OS type virtual machine images (VMware VMDK files, etc, that have been block-aligned) can significantly decrease the amount of storage space consumed. However, the potential for performance degradation as a result of block sharing and fragmentation should be carefully considered first.

OneFS SmartDedupe does not deduplicate across files that have different protection settings. For example, if two files share blocks, but file1 is parity protected at +2:1, and file2 has its protection set at +3, SmartDedupe will not attempt to deduplicate them. This ensures that all files and their constituent blocks are protected as configured.  Additionally, SmartDedupe won’t deduplicate files that are stored on different node pools. For example, if file1 and file2 are stored on tier 1 and tier 2 respectively, and tier1 and tier2 are both protected at 2:1, OneFS won’t deduplicate them. This helps guard against performance asynchronicity, where some of a file’s blocks could live on a different tier, or class of storage, than others.

OneFS performance resource management provides statistics for the resources used by jobs – both cluster-wide and per-node. This information is provided via the ‘isi statistics workload’ CLI command. Available in a ‘top’ format, this command displays the top jobs and processes, and periodically updates the information.

For example, the following syntax shows, and indefinitely refreshes, the top five processes on a cluster:

# isi statistics workload --limit 5 –format=top

last update:  2020-09-23T16:45:25 (s)ort: default

CPU  Reads Writes    L2   L3   Node SystemName      JobType

1.4s 9.1k 0.0        3.5k 497.0 2    Job:  237       IntegrityScan[0]

1.2s 85.7 714.7      4.9k 0.0  1    Job:  238       Dedupe[0]

1.2s 9.5k 0.0        3.5k 48.5 1    Job:  237       IntegrityScan[0]

1.2s 7.4k 541.3      4.9k 0.0  3    Job: 238        Dedupe[0]

1.1s 7.9k 0.0        3.5k 41.6 2    Job:  237       IntegrityScan[0]

From the output, we can see that two job engine jobs are in progress: Dedupe (job ID 238), which runs at low impact and priority level 4 is contending with IntegrityScan (job ID 237), which runs by default at medium impact and priority level 1.

The resource statistics tracked per job, per job phase, and per node include CPU, reads, writes, and L2 & L3 cache hits. Unlike the output from the ‘top’ command, this makes it easier to diagnose individual job resource issues, etc.

Below are some examples of typical space reclamation levels that have been achieved run SmartDedupe on various data types. Be aware though that these space savings values are provided solely as rough guidance. Since no two data sets are alike (unless they’re replicated), actual results can and will vary considerably from these examples.

Workflow / Data Type Typical Space Savings
Virtual Machine Data 35%
Home Directories / File Shares 25%
Email Archive 20%
Engineering Source Code 15%
Media Files 10%

SmartDedupe is included as a core component of OneFS but requires a valid product license key in order to activate. An unlicensed cluster will show a SmartDedupe warning until a valid product license has been applied to the cluster.

For optimal cluster performance, observing the following SmartDedupe best practices is recommended.

  • Deduplication is most effective when applied to data sets with a low rate of change – for example, archived data.
  • Enable SmartDedupe to run at subdirectory level(s) below /ifs.
  • Avoid adding more than ten subdirectory paths to the SmartDedupe configuration policy,
  • SmartDedupe is ideal for home directories, departmental file shares and warm and cold archive data sets.
  • Run SmartDedupe against a smaller sample data set first to evaluate performance impact versus space efficiency.
  • Schedule deduplication to run during the cluster’s low usage hours – i.e. overnight, weekends, etc.
  • After the initial dedupe job has completed, schedule incremental dedupe jobs to run every two weeks or so, depending on the size and rate of change of the dataset.
  • Always run SmartDedupe with the default ‘low’ impact Job Engine policy.
  • Run the dedupe assessment job on a single root directory at a time. If multiple directory paths are assessed in the same job, you will not be able to determine which directory should be deduplicated.
  • When replicating deduplicated data, to avoid running out of space on target, it is important to verify that the logical data size (i.e. the amount of storage space saved plus the actual storage space consumed) does not exceed the total available space on the target cluster.
  • Run a deduplication job on an appropriate data set prior to enabling a snapshots schedule.
  • Where possible, perform any snapshot restores (reverts) before running a deduplication job. And run a dedupe job directly after restoring a prior snapshot version.

With dedupe, there’s always trade-off between cluster resource consumption (CPU, memory, disk), the potential for data fragmentation and the benefit of increased space efficiency. Therefore, SmartDedupe is not ideally suited for high performance workloads.

  • Depending on an application’s I/O profile and the effect of deduplication on the data layout, read and write performance and overall space savings can vary considerably.
  • SmartDedupe will not permit block sharing across different hardware types or node pools to reduce the risk of performance asymmetry.
  • SmartDedupe will not share blocks across files with different protection policies applied.
  • OneFS metadata, including the deduplication index, is not deduplicated.
  • Deduplication is a long running process that involves multiple job phases that are run iteratively.
  • SmartDedupe will not attempt to deduplicate files smaller than 32KB in size.
  • Dedupe job performance will typically improve significantly on the second and subsequent job runs, once the initial index and the bulk of the shadow stores have already been created.
  • SmartDedupe will not deduplicate the data stored in a snapshot. However, snapshots can certainly be created of deduplicated data.
  • If deduplication is enabled on a cluster that already has a significant amount of data stored in snapshots, it will take time before the snapshot data is affected by deduplication. Newly created snapshots will contain deduplicated data, but older snapshots will not.
  • Any file on a cluster that is ‘un-deduped’ is automatically marked to ‘not re-dupe’. In order to reapply deduplicate to an un-deduped file, specific flags on the shadow store need to be cleared. For example:How to check the setting

    # isi get -D /ifs/data/test | grep -i dedupe

    *  Do not dedupe:      0

    Undedupe the file via isi_sstore :

    # isi_sstore undedupe /ifs/data/test

    Verify the setting:

    # isi get -D /ifs/data/test | grep -i dedupe

    *  Do not dedupe:      1

    ​​​​​​​If you want that file to participate in dedupe again then you need reset the “Do not dedupe” flag.

    How to reset the path.

    isi_sstore attr –no_dedupe=false <path>

SmartDedupe is one of several components of OneFS that enable OneFS to deliver a very high level of raw disk utilization. Another major storage efficiency attribute is the way that OneFS natively manages data protection in the file system. Unlike most file systems that rely on hardware RAID, OneFS protects data at the file level and, using software-based erasure coding, allows most customers to enjoy raw disk space utilization levels in the 80% range or higher. This is in contrast to the industry mean of around 50-60% raw disk capacity utilization. SmartDedupe serves to further extend this storage efficiency headroom, bringing an even more compelling and demonstrable TCO advantage to primary file based storage.

SmartDedupe post process dedupe is compatible with OneFS in-line data reduction (which we’ll cover in another blog post series) and vice versa. In-line compression is able to compress OneFS shadow stores. However, for SmartDedupe to process compressed data, the SmartDedupe job will have to decompress it first in order to perform deduplication, which is an addition resource overhead.