OneFS SmartQoS Configuration and Setup

In the previous article in this series, we looked at the underlying architecture and management of SmartQoS in OneFS 9.5. Next, we’ll step through an example SmartQoS configuration via the CLI and WebUI.

After an initial set up, configuring a SmartQoS protocol Ops limit comprises four fundamental steps. These are:

Step Task Description Example
1 Identify Metrics of interest Used for tracking, to enforce an Ops limit Uses ‘path and ‘protocol’ for the metrics to identify the workload.
2 Create a Dataset For tracking all of the chosen metric categories Create the dataset ‘ds1’ with the metrics identified.
3 Pin a Workload To specify exactly which values to track within the chosen metrics path: /ifs/data/client_exports

protocol: nfs3

4 Set a Limit To limit Ops based on the dataset, metrics (categories), and metric values defined by the workload Protocol_ops limit: 100


Step 1:

First, select a metric of interest. For this example we’ll use the following:

  • Protocol: NFSv3
  • Path: /ifs/test/expt_nfs

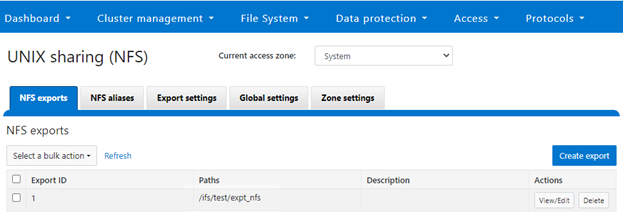
If not already present, create and verify an NFS export – in this case at /ifs/test/expt_nfs:

# isi nfs exports create /ifs/test/expt_nfs

# isi nfs exports list

ID Zone Paths Description

------------------------------------------------

1 System /ifs/test/expt_nfs

------------------------------------------------

Or from the WebUI, under Protocols UNIX sharing (NFS) > NFS exports:


Step 2:

The ‘dataset’ designation is used to categorize workload by various identification metrics including:

ID Metric Details
Username UID or SID
Primary groupname Primary GID or GSID
Secondary groupname Secondary GID or GSID
Zone name
IP address Local or remote IP address or IP address range
Path Except for S3 protocol
Share SMB share or NFS export ID
Protocol NFSv3, NFSv4, NFSoRDMA, SMB, or S3

SmartQoS in OneFS 9.5 only allows protocol OPs as the transient resources used for configuring a limit ceiling.

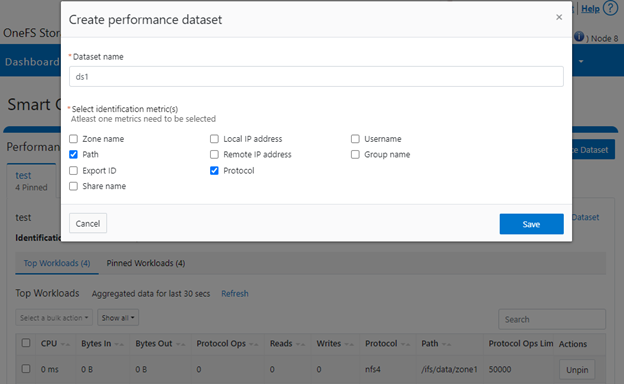
For example, the following CL I command can be used to create a dataset ‘ds1’, specifying protocol and path as the ID metrics:

# isi performance datasets create --name ds1 protocol path

Created new performance dataset 'ds1' with ID number 1.

Note: Resource usage tracking by ‘path’ metric is only supported by SMB and NFS.

The following command will display any configured datasets:

# isi performance datasets list

Or, from the WebUI by navigating to Cluster management > Smart QoS:


Step 3:

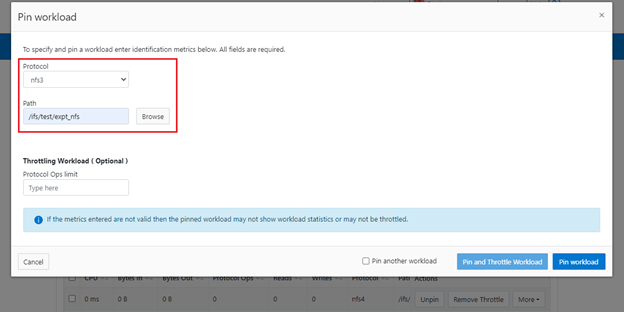
After the dataset has been created, a workload can be pinned to it by specifying the metric values. For example:

# isi performance workloads pin ds1 protocol:nfs3 path: /ifs/test/expt_nfs

Pinned performance dataset workload with ID number 100.

Or from the WebUI by browsing to Cluster management > Smart QoS > Pin workload:

After pinning a workload, the entry will show in the ‘Top Workloads’ section of the WebUI page. However, wait at least 30 seconds to start receiving updates.

To list all the pinned workloads from a specified dataset, use the following command:

# isi performance workloads list ds1

The prior command’s output indicates that there are currently no limits set for this workload.

By default, a protocol ops limit exists for each workload. However it is set to the maximum (the maximum value of a 64-bit unsigned integer). This is represented in the CLI output by a dash (“-“) if a limit has not been explicitly configured:

# isi performance workloads list ds1

ID   Name  Metric Values           Creation Time       Cluster Resource Impact  Client Impact  Limits

--------------------------------------------------------------------------------------

100  -     path:/ifs/test/expt_nfs 2023-02-02T12:06:05  -          -             -

           protocol:nfs3

--------------------------------------------------------------------------------------

Total: 1


Step 4:

For a pinned workload in dataset, a limit for the protocol ops limit can be configured from the CLI using the following syntax:

# isi performance workloads modify <dataset> <workload ID> --limits protocol_ops:<value>

When configuring SmartQoS, always be aware that it is a powerful performance throttling tool which can be applied to significant areas of a cluster’s data and userbase. For example, protocol OPs limits can be configured for metrics such as ‘path:/ifs’, which would affect the entire /ifs filesystem, or ‘zone_name:System’ which would limit the System access zone and all users within it. While such configurations are entirely valid, they would have a significant, system-wide impact. As such, caution should be exercised when configuring SmartQoS to avoid any inadvertent, unintended or unexpected performance constraints.

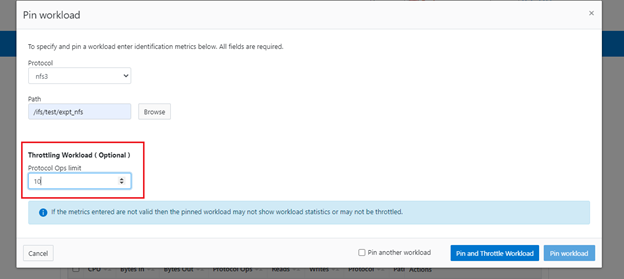
In the following example, the dataset is ‘ds1’, the workload ID is ‘100’, and the protocol OPs limit is set to value ‘10’:

# isi performance workloads modify ds1 100 --limits protocol_ops:10

protocol_ops: 18446744073709551615 -> 10

Or from the WebUI by browsing to Cluster management > Smart QoS > Pin and throttle workload:

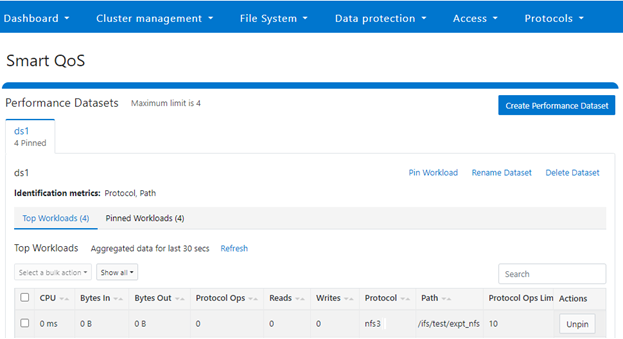
The ‘isi performance workloads’ command can be used in ‘list’ mode to show details of the workload ‘ds1’. In this case, ‘Limits’ is set to protocol_ops = 10.

# isi performance workloads list test

ID   Name  Metric Values           Creation Time       Cluster Resource Impact  Client Impact  Limits

--------------------------------------------------------------------------------------

100  -     path:/ifs/test/expt_nfs 2023-02-02T12:06:05  -  -  protocol_ops:10

           protocol:nfs3

--------------------------------------------------------------------------------------

Total: 1

Or in ‘view’ mode:

# isi performance workloads view ds1 100

                     ID: 100

                   Name: -

          Metric Values: path:/ifs/test/expt_nfs, protocol:nfs3

          Creation Time: 2023-02-02T12:06:05

Cluster Resource Impact: -

          Client Impact: -

                 Limits: protocol_ops:10

Or from the WebUI by browsing to Cluster management > Smart QoS:

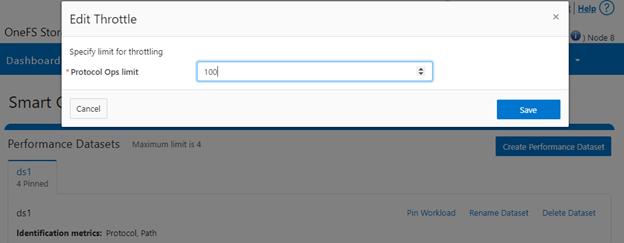
The limit value of a pinned workload can be easily modified with the following CLI syntax. For example, to set the limit to 100 OPs:

# isi performance workloads modify ds1 100 --limits protocol_ops:100

Or from the WebUI by browsing to Cluster management > Smart QoS > Edit throttle:

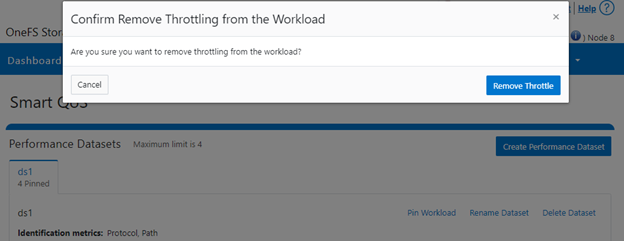
Similarly, the following CLI command can be used to easily remove a protocol ops limit for a pinned workload:

# isi performance workloads modify ds1 100 --no-protocol-ops-limit

Or from the WebUI by browsing to Cluster management > Smart QoS > Remove throttle:

OneFS SmartQoS Architecture and Management

The SmartQoS Protocol Ops limits architecture, introduced in OneFS 9.5, involves three primary capabilities:

  • Resource tracking
  • Resource limit distribution
  • Throttling

Under the hood, the OneFS protocol heads (NFS, SMB and S3) identify and track how many protocol operations are being processed through a specific export or share. The existing partitioned performance (PP) reporting infrastructure is leveraged for cluster wide resource usage collection, limit calculation and distribution, along with new OneFS 9.5 functionality to support pinned workload protocol Ops limits.

The protocol scheduling module (LwSched) has an inbuilt throttling capability that allows the execution of individual operations to be delayed by temporarily pausing them, or ‘sleeping’. Additionally, in OneFS 9.5, the partitioned performance kernel modules have also been enhanced to calculate ‘sleep time’ based on operation count resource information (requested, average usage etc.) – both within the current throttling window, and for a specific workload.

The fundamental SmartQoS workflow can be characterized as follows:

  1. Configuration via CLI, pAPI, or WebUI.
  2. Statistics gatherer obtains Op/s data from the partitioned performance (PP) kernel.
  3. Stats gatherer communicates Op/s data to PP leader service.
  4. Leader queries config manager for per-cluster rate limit.
  5. Leader calculates per-node limit.
  6. PP follower service is notified of per-node Op/s limit.
  7. Kernel is informed of new per-node limit.
  8. Work is scheduled with rate-limited resource.
  9. Kernel returns sleep time, if needed.

When an admin configures a per-cluster protocol Ops limit, the statistics gathering service, isi_stats_d, begins collecting workload resource information every 30 seconds by default from the partitioned performance (PP) kernel on each node in the cluster and notifies the isi_pp_d leader service of this resource info. Next, the leader gets the per-cluster protocol Ops limit plus additional resource consumption metrics from the isi_acct_cpp service via isi_tardis_d, the OneFS cluster configuration service and calculates the protocol Ops limit of each node for the next throttling window. It then instructs the isi_pp_d follower service on each node to update the kernel with the newly calculated protocol Ops limit, plus a request to reset throttling window.

Upon receipt of a scheduling request for a work item from the protocol scheduler (LwSched), the kernel calculates the required ‘sleep time’ value, based on the current node protocol Ops limit and resource usage in the current throttling window. If insufficient resources are available, the thread for work item execution thread is put to sleep for a specific interval returned from PP kernel. If resources are available, or the thread is reactivated from sleeping, it executes the work item and reports the resource usages statistics back to PP, releasing any scheduling resources it may own.

SmartQoS can be configured through either the CLI, platform API, or WebUI, and OneFS 9.5 introduces a new SmartQoS WebUI page to support this. Note that SmartQoS is only available once an upgrade to OneFS 9.5 has been committed, and any attempt to configure or run the feature prior to upgrade commit will fail with the following message:

# isi performance workloads modify DS1 -w WS1 --limits protocol_ops:50000

 Setting of protocol ops limits not available until upgrade has been committed

Once a cluster is running OneFS 9.5 and the release is committed, the SmartQoS feature is enabled by default. This, and the current configuration, can be confirmed using the following CLI command:

 # isi performance settings view

                   Top N Collections: 1024

        Time In Queue Threshold (ms): 10.0

 Target read latency in microseconds: 12000.0

Target write latency in microseconds: 12000.0

          Protocol Ops Limit Enabled: Yes

In OneFS 9.5, the ‘isi performance settings modify’ CLI command now includes a ‘protocol-ops-limit-enabled’ parameter to allow the feature to be easily disabled (or re-enabled) across the cluster. For example:

# isi performance settings modify --protocol-ops-limit-enabled false

protocol_ops_limit_enabled: True -> False

Similarly, the ‘isi performance settings view’ CLI command has been extended to report the protocol OPs limit state:

# isi performance settings view *

Top N Collections: 1024

Protocol Ops Limit Enabled: Yes

In order to set a protocol OPs limit on workload from the CLI, the ‘isi performance workload pin’ and ‘isi performance workload modify’ commands now accept an optional ‘–limits’ parameter. For example, to create a pinned workload with the ‘protocol_ops’ limit set to 10000:

# isi performance workload pin test protocol:nfs3 --limits

protocol_ops:10000

Similarly, to modify an existing workload’s ‘protocol_ops’ limit to 20000:

# isi performance workload modify test 101 --limits protocol_ops:20000

protocol_ops: 10000 -> 20000

When configuring SmartQoS, always be cognizant of the fact that it is a powerful throttling tool which can be applied to significant areas of a cluster’s data and userbase. For example, protocol OPs limits can be configured for metrics such as ‘path:/ifs’, which would affect the entire /ifs filesystem, or ‘zone_name:System’ which would limit the System access zone and all users within it.

While such configurations are entirely valid, they would have a significant, system-wide impact. As such, caution should be exercised when configuring SmartQoS to avoid any inadvertent, unintended or unexpected performance constraints.

To clear a protocol Ops limit on workload, the ‘isi performance workload’ modify CLI command has been extended to accept an optional ‘–noprotocol-ops-limit’ argument. For example:

# isi performance workload modify test 101 --no-protocol-ops-limit

protocol_ops: 20000 -> 18446744073709551615

Note that the value of ‘18446744073709551615’ in the command output above represents ‘NO_LIMIT’ set.

A workload’s protocol Ops limit can be viewed using the ‘isi performance workload list’ and ‘isi performance workload view’ CLI commands, which have been modified in OneFS 9.5 to display the limits appropriately. For example:

# isi performance workload list test

ID Name Metric Values Creation Time Impact Limits

---------------------------------------------------------------------

101 - protocol:nfs3 2023-02-02T22:35:02 - protocol_ops:20000

---------------------------------------------------------------------


# isi performance workload view test 101

ID: 101

Name: -

Metric Values: protocol:nfs3

Creation Time: 2023-02-02T22:35:02

Impact: -

Limits: protocol_ops:20000

In the next article in this series, we’ll step through an example SmartQoS configuration and verification from both the CLI and WebUI.

OneFS SmartQoS

Built atop the partitioned performance (PP) resource monitoring framework, OneFS 9.5 introduces a new SmartQoS performance management feature. SmartQoS allows a cluster administrator to set limits on the maximum number of protocol operations per second (Protocol Ops) that individual pinned workloads can consume, in order to achieve desired business workload prioritization. Among the benefits of this new QoS functionality are:

  • Enabling IT infrastructure teams to achieve performance SLAs.
  • Allowing throttling of rogue or low priority workloads and hence prioritization of other business critical workloads.
  • Helping minimize data unavailability events due to overloaded clusters.

This new SmartQoS feature in OneFS 9.5 supports the NFS, SMB and S3 protocols, including mixed traffic to the same workload.

But first, a quick refresher. The partitioned performance resource monitoring framework, which initially debuted in OneFS 8.0.1, enables OneFS to track and report the use of transient system resources (resources that only exist at a given instant), providing insight into who is consuming what resources, and how much of them. Examples include CPU time, network bandwidth, IOPS, disk accesses, and cache hits, etc.

OneFS partitioned performance is an ongoing project which, in OneFS 9.5 now provides control as well as insights. This allows control of work flowing through the system, prioritization and protection of mission critical workflows, and the ability to detect if a cluster is at capacity.

Since identification of work is highly subjective, OneFS partitioned performance resource monitoring provides significant configuration flexibility, allowing cluster admins to craft exactly how they wish to define, track, and manage workloads. For example, an administrator might want to partition their work based on criterial like which user is accessing the cluster, the export/share they are using, which IP address they’re coming from – and often a combination of all three.

OneFS has always provided client and protocol statistics, however they were typically front-end only. Similarly, OneFS provides CPU, cache and disk statistics, but they did not display who was consuming them. Partitioned performance unites these two realms, tracking the usage of the CPU, drives and caches, and spanning the initiator/participant barrier.

OneFS collects the resources consumed, grouped into distinct workloads, and the aggregation of these workloads comprise a performance dataset.

Item Description Example
Workload A set of identification metrics and resources used {username:nick, zone_name:System} consumed {cpu:1.5s, bytes_in:100K, bytes_out:50M, …}
Performance Dataset The set of identification metrics to aggregate workloads by

The list of workloads collected matching that specification

{usernames, zone_names}
Filter A method for including only workloads that match specific identification metrics. Filter{zone_name:System}

·         {username:nick, zone_name:System}

·         {username:jane, zone_name:System}

·         {username:nick, zone_name:Perf}

The following metrics are tracked by partitioned performance resource monitoring:

Category Items
Identification Metrics ·         Username / UID / SID

·         Primary Groupname / GID / GSID

·         Secondary Groupname / GID / GSID

·         Zone Name

·         Local/Remote IP Address/Range

·         Path

·         Share / Export ID

·         Protocol

·         System Name

·         Job Type

Transient Resources ·         CPU Usage

·         Bytes In/Out – Net traffic minus TCP headers

·         IOPs – Protocol OPs

·         Disk Reads – Blocks read from disk

·         Disk Writes – Block written to the journal, including protection

·         L2 Hits – Blocks read from L2 cache

·         L3 Hits – Blocks read from L3 cache

·         Latency – Sum of time taken from start to finish of OP

o   ReadLatency

o   WriteLatency

o   OtherLatency

Performance Statistics ·         Read/Write/Other Latency
Supported Protocols ·         NFS

·         SMB

·         S3

·         Jobs

·         Background Services


Be aware that, in OneFS 9.5, SmartQoS currently does not support the following Partitioned Performance criteria:

Unsupported Group Unsupported Items
Metrics •       System Name

•       Job Type

Workloads •       Top workloads (as they are dynamically and automatically generated by kernel)

•       Workloads belonging to the ‘system’ dataset

Protocols •       Jobs

•       Background services

When pinning a workload to a dataset, note that the more metrics there are in that dataset, the more parameters need to be defined when pinning to it. For example:

Dataset = zone_name, protocol, username

To set a limit on this dataset, you’d need to pin the workload by also specifying the zone name, protocol, and username.

When using the remote_address and/or local_address metrics, you can also specify a subnet. For example: 10.123.456.0/24

With the exception of the system dataset, performance datasets must be configured before statistics are collected.

For SmartQoS in OneFS 9.5, limits can be defined and configured as a maximum number of protocol operations (Protocol Ops) per second across the following protocols:

  • NFSv3
  • NFSv4
  • NFSoRDMA
  • SMB
  • S3

A Protocol Ops limit can be applied to up to 4 custom datasets. All pinned workloads within a dataset can have a limit configured, up to a maximum of 1024 workloads per dataset. If multiple workloads happen to share a common metric value with overlapping limits, the lowest limit that is configured would be enforced

Note that, on upgrading to OneFS 9.5, SmartQoS is activated only once the new release has been successfully committed.

In the next article in this series, we’ll take a deeper look at SmartQoS’ underlying architecture and workflow.

OneFS SmartPools Transfer Limits Configuration and Management

In the first article in this series, we looked at the architecture and considerations of the new OneFS 9.5’s SmartPools Transfer Limits. Now, we turn our attention to the configuration and management of this feature.

From the control plane side, OneFS 9.5 contains several WebUI and CLI enhancements to reflect the new SmartPools Transfer Limits functionality. Probably the most obvious change is in the ‘local storage usage status’ histogram, where tiers and their child nodepools have been aggregated, for a more logical grouping. Also blue limit-lines have been added above each of the storagepools, and a red warning status displayed for any pools that have exceeded the transfer limit.

Similarly, the storage pools status page now includes transfer limit details, with the 90% limit displayed for any storagepools using the default setting.

From the CLI, the ‘isi storagepool nodepools view’ command reports the transfer limit status and percentage for a pool. The used SSD and HDD bytes percentages, in the command output indicate where the pool utilization is relative to the transfer limit.

# isi storagepool nodepools view h5600_200tb_6.4tb-ssd_256gb
ID: 42
Name: h5600_200tb_6.4tb-ssd_256gb
Nodes: 77, 78, 79, 80, 81, 82, 83, 84
Node Type IDs: 10
Protection Policy: +2d:1n
Manual: No
L3 Enabled: Yes
L3 Migration Status: l3
Tier: -
Transfer Limit: 90%
Transfer Limit State: default
Usage
Avail Bytes: 1.13P
Avail SSD Bytes: 0.00
Avail HDD Bytes: 1.13P
Balanced: No
Free Bytes: 1.18P
Free SSD Bytes: 0.00
Free HDD Bytes: 1.18P
Total Bytes: 1.41P
Total SSD Bytes: 0.00
Total HDD Bytes: 1.41P
Used Bytes: 229.91T (17%)
Used SSD Bytes: 0.00 (0%)
Used HDD Bytes: 229.91T (17%)
Virtual Hot Spare Bytes: 56.94T

The storage transfer limit can be easily configured from the CLI as for either a  specific pool, as a default, or disabled, using the new –transfer-limit and –default-transfer-limit flags.

The following CLI command can be used to set the transfer limit for a specific storagepool:

# isi storagepool nodepools/tier modify --transfer-limit={0-100, default, disabled}

For example, to set a limit of 80% on an A200 nodepool:

# isi storagepool a200_30tb_1.6tb-ssd_96gb modify --transfer-limit=80

Or to set the default limit of 90% on tier ‘perf1’:

# isi storagepool perf1 --transfer-limit=default

Note that setting the transfer limit of a tier automatically applies to all its child nodepools, regardless of any prior child limit configurations.

The global ‘isi storage settings view’ CLI command output shows the default transfer limit, which is 90%, but can be configured between 0 to 100% if desired.

# isi storagepool settings view

     Automatically Manage Protection: files_at_default

Automatically Manage Io Optimization: files_at_default

Protect Directories One Level Higher: Yes

       Global Namespace Acceleration: disabled

       Virtual Hot Spare Deny Writes: Yes

        Virtual Hot Spare Hide Spare: Yes

      Virtual Hot Spare Limit Drives: 2

     Virtual Hot Spare Limit Percent: 0

             Global Spillover Target: anywhere

                   Spillover Enabled: Yes

              Default Transfer Limit: 90%

        SSD L3 Cache Default Enabled: Yes

                     SSD Qab Mirrors: one

            SSD System Btree Mirrors: one

            SSD System Delta Mirrors: one

This default limit can be reconfigured from the CLI with the following syntax::

# isi storagepool settings modify --default-transfer-limit={0-100, disabled}

For example, to set a new default transfer limit of 85%:

# isi storagepool settings modify --default-transfer-limit=85

And the same changes can be made from the SmartPools WebUI, too, by navigating to Storage pools > SmartPools settings:

Once a SmartPools job has completed in OneFS 9.5, the job report contains a new field that reports any ‘files not moved due to transfer limit exceeded’.

# isi job reports view 1056

...

...

Policy/testpolicy/Access changes skipped 0

Policy/testpolicy/ADS containers matched 'head’ 0

Policy/testpolicy/ADS containers matched 'snapshot’ 0

Policy/testpolicy/ADS streams matched 'head’ 0

Policy/testpolicy/ADS streams matched 'snapshot’ 0

Policy/testpolicy/Directories matched 'head’ 0

Policy/testpolicy/Directories matched 'snapshot’ 0

Policy/testpolicy/File creation templates matched 0

Policy/testpolicy/Files matched 'head’ 0

Policy/testpolicy/Files matched 'snapshot’ 0

Policy/testpolicy/Files not moved due to transfer limit exceeded 0 

Policy/testpolicy/Files packed 0

Policy/testpolicy/Files repacked 0

Policy/testpolicy/Files unpacked 0

Policy/testpolicy/Packing changes skipped 0

Policy/testpolicy/Protection changes skipped 0

Policy/testpolicy/Skipped files already in containers 0

Policy/testpolicy/Skipped packing non-regular files 0

Policy/testpolicy/Skipped packing regular files 0

Additionally, the ‘SYS STORAGEPOOL FILL LIMIT EXCEEDED’ alert is triggered when a storagepool’s usage has exceeded its transfer limit. Raised at the INFO level. Each hour, CELOG fires off a monitor helper script which will measure how full each storagepool is relative to its transfer limit. The usage is gathered by reading from the diskpool database, and the transfer limits are stored in gconfig. If a nodepool has a transfer limit of 50% and usage of 75%, the monitor helper will report a measurement of 150%, triggering an alert.

# isi event view 126

ID: 126

Started: 11/29 20:32

Causes Long: storagepool: vonefs_13gb_4.2gb-ssd_6gb:hdd usage: 33.4, transfer limit: 30.0

Lnn: 0

Devid: 0

Last Event: 2022-11-29T20:32:16

Ignore: No

Ignore Time: Never

Resolved: No

Resolve Time: Never

Ended: --

Events: 1

Severity: information

And from the WebUI:

And there you have it: Transfer Limits, and the first step in the evolution towards a smarter SmartPools.

OneFS SmartPools Transfer Limits

The new OneFS 9.5 release introduces the first phase of engineering’s Smarter SmartPools initiative, and delivers a new feature called SmartPools transfer limits.

The goal of SmartPools transfer limits is to address spill over. Previously, when file pool policies were executed, OneFS had no guardrails to protect against overfilling the destination or target storage pool. So if a pool was overfilled, data would unexpectedly spill over into other storage pools.

The effects of an overflow would result in storagepool usage exceeding 100%, and the SmartPools job itself doing a considerable amount of unnecessary work, trying to send files to a given storagepool. But since the pool was full, it would then have to send those files off to another storage pool that was below capacity. This would result in data going where it wasn’t intended, and the potential for individual files to end up getting split between pools. Also, if the full pool was on the most performant storage in the cluster, all subsequent newly created data would now land on slower storage, affecting its throughput and latency. The recovery from a spillover can be fairly cumbersome since it’s tough for the cluster to regain balance, and urgent system administration may be required to free space on the affected tier.

In order to address this, SmartPools Transfer Limits allows a cluster admin to configure a storagepool capacity-usage threshold, expressed as a percentage, and beyond which file pool policies stop moving data to that particular storage pool.

These transfer limits only take effect when running jobs that apply filepool policies, such as SmartPools, SmartPoolsTree, and FilePolicy.

The main benefits of this feature are two-fold:

  • Safety, in that OneFS avoids undesirable actions, so the customer is prevented from getting into escalation situations, because SmartPools won’t overfill storage pools.
  • Performance, since transfer limits avoid unnecessary work, and allow the SmartPools job to finish sooner.

Under the hood, a cluster’s storagepool SSD and HDD usage is calculated using the same algorithm as reported by the ‘isi storagepools list’ CLI command. This means that a pool’s VHS (virtual hot spare) reserved capacity is respected by SmartPools transfer limits. When a SmartPools job is running, there is at least one worker on each node processing a single LIN at any given time. In order to calculate the current HDD and SSD usage per storagepool, the worker must read from the diskpool database. To circumvent this potential bottleneck, the filepool policy algorithm caches the diskpool database contents in memory for up to 10 seconds.

Transfer limits are stored in gconfig, and a separate entry is stored within the ‘smartpools.storagepools’ hierarchy for each explicitly defined transfer limit.

Note that in the SmartPools lexicon, ‘storage pool’ is a generic term denoting either a tier or nodepool. Additionally, SmartPools tiers comprise one or more constituent nodepools.

Each gconfig transfer limit entry stores a limit value and the diskpool database identifier of the storagepool that the transfer limit applies to. Additionally, a ‘transfer limit state’ field specifies which of three states the limit is in:

Limit State Description
Default Fallback to the default transfer limit.
Disabled Ignore transfer limit.
Enabled The corresponding transfer limit value is valid.

A SmartPools transfer limit does not affect the general ingress, restriping, or reprotection of files, regardless of how full the storage pool is where that file is located.  So if you’re creating or modifying a file on the cluster, it will be created there anyway. This will continue up until the pool reaches 100% capacity, at which point it will then spill over.

The default transfer limit is 90% of a pool’s capacity, and this applies to all storage pools where the cluster admin hasn’t explicitly set a threshold. Another thing to note is that the default limit doesn’t get set until a cluster upgrade to OneFS 9.5 has been committed. So if you’re running a SmartPools policy job during an upgrade, you’ll have the preexisting behavior, which is send the file to wherever the file pool policy instructs it to go. It’s also worth noting that, even though the default transfer limit is set on commit, if a job was running over that commit edge, you’d have to pause and resume it for the new limit behavior to take effect. This is because the new configuration is loaded lazily when the job workers are started up, so even though the configuration changes, a pause and resume is needed to pick up those changes.

SmartPools itself needs to be licensed on a cluster in order for transfer limits to work. And limits can be configured at the tier or nodepool level. But if you change the limit of a tier, it automatically applies to all its child nodepools, regardless of any prior child limit configurations. The transfer limit feature can also be disabled, which results in the same spillover behavior OneFS always displayed, and any configured limits will not be respected.

Note that a filepool policy’s transfer limits algorithm does not consider the size of the file when deciding whether to move it to the policy’s target storagepool, regardless of whether the file is empty, or a large file. Similarly, a target storagepool’s usage must exceed its transfer limit before the filepool policy will stop moving data to that target pool. The assumption here is that any storagepool usage overshoot is insignificant in scale compared to the capacity of a cluster’s storagepool.

A SmartPools file pool policy allow you to send snapshot or HEAD data blocks to different targets, if so desired.

Because the transfer limit applies to the storagepool itself, and not to the file pool policy, it’s important to note that, if you’ve got varying storagepool targets and one file pool policy, you may have a situation where the head data blocks do get moved. But if the snapshot is pointing at a storage pool that has exceeded its transfer limit, it’s blocks will not be moved.

File pool policies also allow you to specify how a mixed node’s SSDs are used: Either as L3 cache, or as an SSD strategy for head and snapshot blocks. If the SSDs in a node are configured for L3, they are not being used for storage, so any transfer limits are irrelevant to it. As an alternative to L3 cache, SmartPools offers three main categories of SSD strategy:  Avoid, which means send all blocks to HDD, Data, which means send everything to SSD, and then metadata read or read-write, which send varying numbers of metadata mirrors to SSD, and data blocks to hard disk.

To reflect this, SmartPools transfer limits are slightly nuanced when it comes to SSD strategies. That is, if the storagepool target contains both HDD and SSD, the usage capacity of both mediums needs to be below the transfer limit in order for the file to be moved to that target. For example, take two node pools, NP1 and NP2.

A file pool policy, Pol1, is configured, that matches all files under /ifs/dir1, with an SSD strategy of metadata write, and pool NP1 as the target for HEAD’s data blocks. For snapshots, the target is NP2, with an ‘avoid’ SSD strategy, so just writing to hard disk for both snapshot data and metadata.

When a SmartPools job runs and attempts to apply this file pool policy, it sees that SSD usage is above the 85% configured transfer limit for NP1. So, even though the hard disk capacity usage is below the limit, neither HEAD data nor metadata will be sent to NP1.

For the snapshot, the SSD usage is also above the NP2 pool’s transfer limit of 90%.

However, since the SSD strategy is ‘avoid’, and because the hard disk usage is below the limit, the snapshot’s data and metadata get successfully sent to the NP2 HDDs.