OneFS Deadlocks and Hang-dumps – Part 3

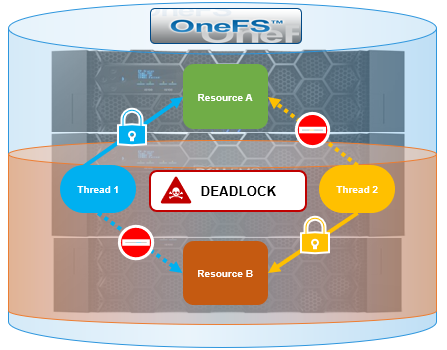
As we’ve seen previously in this series, very occasionally a cluster can become deadlocked and remain in an unstable state until the affected node(s), or sometimes the entire cluster, is rebooted or panicked. However, in addition to the data gathering discussed in the prior article, there are additional troubleshooting steps that can be explored by the more adventurous cluster admin – particularly with regard to investigating a LIN lock.

Lock Domain Resource Description
LIN LIN Every object in the OneFS filesystem (file, directory, internal special LINs) is indexed by a logical inode number (LIN). A LIN provides an extra level of indirection, providing pointers to the mirrored copies of the on-disk inode. This domain is used to provide mutual exclusion around classic BSD vnode operations. Operations that require a stable view of data take a read lock which allows other readers to operate simultaneously but prevents modification. Operations that change data take a write lock that prevents others from accessing that directory while the change is taking place.

 The approach outlined can be useful to assist in identifying the problematic thread(s) and/or node(s) and helping to diagnose and resolve a cluster wide deadlock.

As a quick refresher, the various OneFS locking components include:

Locking Component Description
Coordinator A coordinator node arbitrates locking within the cluster for a particular subset of resources. The coordinator only maintains the lock types held and wanted by the initiator nodes.
Domain Refers to the specific lock attributes (recursion, deadlock detection, memory use limits, etc) and context for a particular lock application. There is one definition of owner, resource, and lock types, and only locks within a particular domain may conflict.
Initiator The node requesting a lock on behalf of a thread is called an initiator. The initiator must contact the coordinator of a resource in order to acquire the lock. The initiator may grant a lock locally for types which are subordinate to the type held by the node. For example, with shared-exclusive locking, an initiator which holds an exclusive lock may grant either a shared or exclusive lock locally.
Lock Type Determines the contention among lockers. A shared or read lock does not contend with other types of shared or read locks, while an exclusive or write lock contends with all other types. Lock types include: Advisory, Anti-virus, Data, Delete, LIN, Mark, Oplocks, Quota, Share Mode, SMB byte-range, Snapshot, and Write.
Locker Identifies the entity which acquires a lock.
Owner A locker which has successfully acquired a particular lock. A locker may own multiple locks of the same or different type as a result of recursive locking.
Resource Identifies a particular lock. Lock acquisition only contends on the same resource. The resource ID is typically a LIN to associate locks with files.
Waiter Has requested a lock but has not yet been granted or acquired it.

So the basic data that will be required for a LIN lock investigation is as follows:

Data Description
<Waiter-LNN> Node number with the largest ‘started’ value.
<Waiting-Address> Address of <Waiter-LNN> node above.
<LIN> LIN from the ‘resource = field of <Waiter-LNN>
<Block-Address> Block address from “resource=’ field of <Waiter-LNN>
<Locker-Node> Node that owns the lock for the <LIN>. Has a non-zero value for ‘owner_count.
<Locker-Address) Address of Locker-Node.

As such, the following process can be used to help investigate a LIN lock:

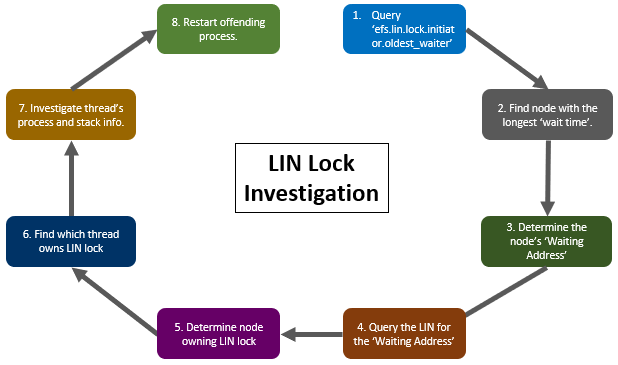
The details for each step above are as follows:

  1. First, execute the following CLI syntax from any node in the cluster to view the LIN lock.’oldest_waiter’ infol:
# isi_for_array -X 'sysctl efs.lin.lock.initiator.oldest_waiter | grep -E "address|started"' | grep -v "exited with status 1"

Querying the ‘efs.lin.lock.initiator.oldest_waiter’ sysctl returns a deluge of information, for example:

# sysctl efs.lin.lock.initiator.oldest_waiter

efs.lin.lock.initiator.oldest_waiter: resource = 1:02ab:002c

waiter = {

    address = 0xfffffe8ff7674080

    locker = 0xfffffe99a52b4000

    type = shared

    range = [all]

    wait_type = wait ok

    refcount_type = stacking

    probe_id = 818112902

    waiter_id = 818112902

    probe_state = done

    started = 773086.923126 (29.933031 seconds ago)

    queue_in = 0xfffff80502ff0f08

    lk_completion_callback = kernel:lk_lock_callback+0

    waiter_type = sync

    created by:

      Stack: --------------------------------------------------

      kernel:lin_lock_get_locker+0xfe

      kernel:lin_lock_get_locker+0xfe

      kernel:bam_vget_stream_invalid+0xe5

      kernel:bam_vget_stream_valid_pref_hint+0x51

      kernel:bam_vget_valid+0x21

      kernel:bam_event_oprestart+0x7ef

      kernel:ifs_opwait+0x12c

      kernel:amd64_syscall+0x3a6

      --------------------------------------------------

The pertinent areas of interest for this exercise are the ‘address’ and ‘started’ (wait time) fields.

If the ‘started’ value is short (ie. less than 90 seconds), or there is no output returned, then this is potentially an MDS lock issue (which can be investigated via the ‘efs.mds.block_lock.initiator.oldest_waiter’ sysctl).

  1. From the above output, examine the results with ‘started’ lines and find the one with the largest value for ‘(###.### seconds ago)’. The node number (<Waiter-LNN>) of this entry is the one of interest.
  2. Next, examine the ‘address =’ entries and find the one with that same node number (<Waiting-Address>).

Note that if there are multiple entries per node, this could indicate a multiple shared lock with another exclusive lock waiting.

  1. Query the LIN for the waiting address on the correct node using the following CLI syntax:
# isi_for_array -n<Waiter-LNN> 'sysctl efs.lin.lock.initiator.active_entries | egrep "resource|address|owner_count" | grep -B5 <Waiting-Address>'
  1. The LIN for this issue is shown in the ‘resource =’ field from the above output. Use the following command to find which node owns the lock on that LIN:
# isi_for_array -X 'sysctl efs.lin.lock.initiator.active_entries |egrep "resource|owner_count"' | grep -A1 <LIN>

Parse the output from this command to find the entry that has a non-zero value for ‘owner_count’. This is the node that owns the lock for this LIN (<Locker-Node>).

  1. Run the following command to find which thread owns the lock on the LIN:
# isi_for_array -n<Locker-Node> 'sysctl efs.lin.lock.initiator.active_entries | grep -A10 <LIN>'
  1. The ‘locker =’ field will provide the thread address (<Locker-Addr>) for the thread holding the lock on the LIN. The following CLI syntax can be used to find the associated process and stack details for this thread:
    # isi_for_array -n<Locker-Node>'sysctl kern.proc.all_stacks |grep -B1 -A20 <Locker-Addr>'
  2. The output will provide the stack and process details. Depending on the process and stack information available from the previous command output, you may be able to terminate (ie. kill -9) the offending process in order to clear the deadlock issue.

Usually within a couple of minutes of killing the offending process, the cluster will become responsive again. The ‘isi get -L’ CLI command can be used to help determine which file was causing the issue, possibly giving some insight as to the root cause.

Please note that if you are unable to identify an individual culprit process, or are unsure of your findings, contact Dell Support for assistance.

OneFS Deadlocks and Hang-dumps – Part 2

As mentioned in the previous article in this series, hang-dumps can occur under the following circumstances.

Type Description
Transient The time to obtain the lock was long enough to trigger a hang-dump, but the lock is eventually granted. This is the less serious situation. The symptoms are typically general performance degradation, but the cluster is still responsive and able to progress.
Persistent The issue typically requires significant remedial action, such as node reboots. This is usually  indicative of a bug in OneFS, although it could also be caused by hardware issues, where hardware becomes unresponsive, and OneFS waits indefinitely for it to recover.

Certain normal OneFS operations, such as those involving very large files, have the potential to trigger a hang-dump with no long-term ill effects. However, in some situations the thread or process waiting for the lock to be freed, or ‘waiter’, is never actually granted the lock on the file. In such cases, users may be impacted.

If a hang-dump is generated as a result of a LIN lock timeout  (the most likely scenario), this indicates that at least one thread in the system has been waiting for a LIN lock for over 90 seconds. The system hang can involve a single thread, or sometimes multiple threads, for example blocking a batch job. The system hang could be affecting interactive session(s), in which case the affected cluster users will likely experience performance impacts.

Specifically, in the case of a LIN lock timeout, if the LIN number is available, it can be easily mapped back to its associated filename using the ‘isi get’ CLI command.

# isi get -L <lin #>

However, a LIN which is still locked may necessitate waiting until the lock is freed before getting the name of the file.

By default, OneFS hang-dump files are written to the /var/crash directory as compressed text files. During a hang-dump investigation, Dell support typically utilizes internal tools to analyze the logs from all of the nodes and generate a graph to show the lock interactions between the lock holders (the thread or process that is holding the file) and lock waiters. The analytics are per-node and include a full dump of the lock state as seen by the local node, the stack of each thread in the system, plus a variety of other diagnostics including memory usage, etc. Since OneFS source-code access is generally required in order to interpret the stack traces, Dell Support can help investigate the hang-dump log file data, which can then be used to drive further troubleshooting.

A deadlocked cluster may exhibit one or more of the following symptoms:

  • Clients are unable to communicate with the cluster via SMB, NFS, SSH, etc.
  • The WebUI is unavailable and/or commands executed from the CLI fail to start or complete.
  • Processes cannot be terminated, even with SIGKILL (kill -9).
  • Degraded cluster performance is experienced, with low or no CPU/network/disk usage.
  • Inability to access files or folders under /ifs.

In order to recover from a deadlock, Dell support’s remediation will sometimes require panicking or rebooting a cluster. In such instances, thorough diagnostic information gathering should be performed prior to this drastic step. Without this diagnostic data, it will be often be impossible to determine the root cause of the deadlock. If the underlying cause of the deadlock is not corrected, rebooting the cluster and restarting the service may not resolve the issue.

The following steps can be run in order to gather data that will be helpful in determining the cause of a deadlock:

  1. First, verify that there are no indeterminate journal transactions. If there are indeterminate journal transactions found, rebooting or panicking nodes will not resolve the issue.
# isi_for_array -X 'sysctl efs.journal.indeterminate_txns'

1: efs.journal.indeterminate_txns: 0
2: efs.journal.indeterminate_txns: 0
3: efs.journal.indeterminate_txns: 0

For each node, if the output of the above command returns zero, this indicates its journal is intact and all transactions are complete. Note that if the output is anything other than zero, the cluster contains indeterminate transactions, and Dell support should be engaged before any further troubleshooting is performed.

2. Next, check the /var/crash/directory for any recently created hang-dump files:

# isi_for_array -s 'ls -l /var/crash | grep -i hang'

Scan the /var/log/messages/ file for any recent references to ‘LOCK TIMEOUT’.

# isi_for_array -s 'egrep -i "lock timeout|hang" /var/log/messages | grep $(date +%Y-%m-%d)'

3.Collect the output from the ‘fstat’ CLI command, which identifies active files:

# isi_for_array -s 'fstat -m > /ifs/data/Isilon_Support/deadlock-data/fstat_$(hostname).txt'&

4. Record the Group Management Protocol (GMP) merge lock state:

# isi_for_array -s 'sysctl efs.gmp.merge_lock_state > /ifs/data/Isilon_Support/deadlock-data/merge_lock_state_$(hostname).txt'

5. Finally, run an ‘isi diagnostics gather’ logset gather to capture relevant cluster data and send the resulting zipped tarfile to Dell Support (via ESRS, FTP, etc).

# isi diagnostics gather start

A cluster reboot can be accomplished via an SSH connection as root to any node in the cluster, as follows:

# isi config

Welcome to the PowerScale configuration console.

Copyright (c) 2001-2022 Dell Inc. All Rights Reserved.

Enter 'help' to see list of available commands.

Enter 'help <command>' to see help for a specific command.

Enter 'quit' at any prompt to discard changes and exit.

        Node build: Isilon OneFS 9.4.0.0 B_MAIN_2978(RELEASE)

        Node serial number: JACNT194540666

TME1 >>> reboot all
 

!! You are about to reboot the entire cluster

Are you sure you wish to continue? [no] yes

Alternatively, the following CLI syntax can be used to reboot a single node from an SSH connection to it:

# kldload reboot_me

Or to reboot the cluster:

# isi_for_array -x$(isi_nodes -L %{lnn}) 'kldload reboot_me'

Note that simply shutting down or rebooting the affected node(s), or the entire cluster), while typically the quickest path to get up and running again, will not generate the core files required for debugging. If a root cause analysis is desired, these node(s) will need to be panicked in order to generate a dump of all active threads.

Only perform a node panic under the direct supervision of Dell Support! Be aware that panics bypass a number of important node shutdown functions, including unmounting /ifs, etc. However, a panic will generate additional kernel core information which is typically required by Dell Support in order to perform a thorough diagnosis. In situations where the entire cluster needs to be panicked, the recommendation is to start with the highest numbered node and work down to lowest. For each node that’s panicked, the debug information is written to the /var/crash directory, and can be identified by the ‘vmcore’ prefix.

If instructed by Dell Support to do so, the ‘isi_rbm_panic’ CLI command can be used to panic a node, with the argument being the logical node number (LNN) of the desired node to target. For example, to panic a node with LNN=2:

# isi_rbm_panic 2

If in any doubt, the following CLI syntax will return the corresponding node ID and node LNN for each node in the cluster:

# isi_nodes %{id} , %{lnn}

OneFS Deadlocks and Hang-dumps

A principal benefit of the OneFS distributed file system is its ability to efficiently coordinate operations that happen on separate nodes. File locking enables multiple users or processes to access data concurrently and safely. Since all nodes in an PowerScale cluster operate on the same single-namespace file system simultaneously, it requires mutual exclusion mechanisms to function correctly. For reading data, this is a fairly straightforward process involving shared locks. With writes, however, things become more complex and require exclusive locking, since data must be kept consistent.

Under the hood, the locks OneFS uses to provide consistency inside the file system (internal) are separate from the file locks provided for consistency between applications (external). This allows OneFS to reallocate a file’s metadata and data blocks while the file itself is locked by an application. This is the premise of OneFS autobalance, reprotection and tiering, where restriping is performed behind the scenes in small chunks, in order to minimize disruption.

OneFS has a fully distributed lock manager (DLM) that marshals locks across all the nodes in a cluster. This locking manager allows for multiple lock types to support both file system locks as well as cluster-coherent protocol-level locks, such as SMB share mode locks or NFS advisory-mode locks. The DLM distributes the lock data across all the nodes in the cluster. In a mixed cluster, the DLM will balance the memory utilization so that the lower-power nodes are not bullied.

OneFS includes the following lock domains:

Lock Domain Resource Description
Advisory Lock LIN The advisory lock domain (advlock) implements local POSIX advisory locks and NFS NLM locks.
Anti-virus LIN, snapID The AV domain implements locks used by OneFS’ ICAP Antivirus feature.
Data LIN, LBN The datalock lock domain implements locks on regions of data within a file. By reducing the locking granularity to below the file level, this enables simultaneous writers to multiple sections of a single file.
Delete LIN The ref lock domain exists to enable POSIX delete-on-close semantics. In a POSIX filesystem, unlinking an open file does not remove the space associated with the file until every thread accessing that file closes the file.
ID Map B-tree key The idmap database contains mappings between POSIX (uid, gid) and Windows (SID) identities. This lock domain provides concurrency control for the idmap database.
LIN LIN Every object in the OneFS filesystem (file, directory, internal special LINs) is indexed by a logical inode number (LIN). A LIN provides an extra level of indirection, providing pointers to the mirrored copies of the on-disk inode. This domain is used to provide mutual exclusion around classic BSD vnode operations. Operations that require a stable view of data take a read lock which allows other readers to operate simultaneously but prevents modification. Operations that change data take a write lock that prevents others from accessing that directory while the change is taking place.
MDS Lowest baddr All metadata in the OneFS filesystem is mirrored for protection. Operations involving read/write of such metadata are protected using locks in the Mirrored Data Structure (MDS) domain.
Oplocks LIN, snapID The Oplock lock domain implements the underlying support for opportunistic locks and leases.
Quota Quota Domain ID The Quota domain is used to implement concurrency control to quota domain records.
Share mode LIN, snapID The share_mode_lock domain is used to implement the Windows share mode locks.
SMB byte-range (CBRL) The cbrl lock domain implements support for byte-range locking.

 Each lock type implements a set of key/value pairs, and can additionally support a ‘byte range’, or a pair of file offsets, and a ‘user data’ block.

In addition to managing locks on files, DLM also orchestrates access to the storage drives, too. Multiple domains, advisory file locks (advlock), mirrored metadata operations (MDS locks), and logical inode number (LIN locks) for operations involving file system objects that have an inode (ie. files or directories) exist within the lock manager. Within these, LIN locks constitute the lion’s share of OneFS locking issues.

Much like OS-level locking, DLM’s operations are typically invisible to end users. That said, DLM sets a maximum time to wait to obtain a lock. When this threshold is exceeded, OneFS automatically triggers a diagnostic information-gathering process, or hang-dump. Note that the triggering of a hang-dump is not necessarily indicative of an issue, but should definitely prompt some further investigation. Hang-dumps will be covered in more depth in a forthcoming blog article in this series.

So what exactly is deadlock? When one or more processes have obtained locks on resources, a point can be reached in which each process prevents another from obtaining a lock, rendering none of the processes able to proceed. This condition is known as a deadlock.

In the image above, thread 1 has an exclusive lock on Resource A, but also requires Resource B in order to complete execution. Since the Resource B lock is unavailable, thread 1 will have to wait for thread 2 to release it’s lock on Resource B. At the same time, thread 2 has obtained an exclusive lock on Resource B, but requires Resource A for finishing execution. Since the Resource A lock is unavailable, if thread 2 attempts to lock Resource A, both processes will wait indefinitely for each other.

Any multi-process file system architecture that involves locking has the potential for deadlocks if any thread needs to acquire more than one lock at the same time. There are typically two general approaches to handling this scenario:

Option Description
Avoidance Attempt to ensure the code cannot deadlock. This approach involves mechanisms such as consistently acquiring locks in the same order. This approach is generally challenging, not always practical, and can have adverse performance implications for the fast path code.
Acceptance Acknowledge that deadlocks will occur and develop appropriate handling methods.

While OneFS ultimately takes the latter approach, it strives to ensure that deadlocks don’t occur. However, under rare conditions, it is more efficient to manage deadlocks by simply breaking and reestablishing the locks.

In OneFS parlance, a ‘hang-dump’ is a cluster event, resulting from a cluster detecting  a ‘hang’ condition, during which the isi_hangdump_d service generates a set of log files. This typically occurs as a result of merge lock timeouts and deadlocks, and while hang-dumps are typically triggered automatically, they can also be manually initiated if desired.

OneFS monitors each lock domain and has a built-in ‘soft timeout’ (the amount of time in which OneFS can generally be expected to satisfy a lock request) associated with each. If a thread holding a lock blocks another thread’s attempt to obtain a conflicting lock type for longer than the soft timeout period, a hang-dump is triggered to collect a substantial quantity of system state information for potential diagnostic purposes, including the lock state of each domain, plus the stack traces of every thread on each node in the cluster.

When a thread is blocked for an extended period of time, any client that is waiting for the work that the thread is performing is also blocked. The external symptoms resulting from this can include:

  • Open applications stop taking input but do not shut down.
  • Open windows or dialogues cannot be closed.
  • The system cannot be restarted normally because  it does not respond to commands.
  • A node does not respond to client requests.

Hang-dumps can occur as a result of the following conditions:

Type Description
Transient The time to obtain the lock was long enough to trigger a hang-dump, but the lock is eventually granted. This is the less serious situation. The symptoms are typically general performance degradation, but the cluster is still responsive and able to progress.
Persistent The issue typically requires impactful remedial action, such as node reboots. This is usually  indicative of either a defect or bug in OneFS or hardware issue, where a cluster component becomes unresponsive, and OneFS waits indefinitely for it to recover.

Note that a OneFS hang-dump is not necessarily indicative of a serious issue.

OneFS System Logging and Ilog

The OneFS ilog service is a general logging facility for the cluster, allowing applications and services to rapidly decide if or where to log messages, based on the currently active logging configuration. Historically, OneFS used syslog directly or via custom wrappers, and the isi_ilog daemon provides features common to those wrappers plus an array of other capabilities. These include runtime-modification, the ability to log to file, syslog, and or stderr, additional context including message plus ‘component’, ‘job’, and ‘thread_id’, and default fall-back to syslog.

Under the hood, there are actually two different ilog components; kernel ilog and userspace ilog.

Kernel ilog controls log verbosity at runtime, avoids installing a new kernel module to enable more log detail, and allows only enabling such detailed logging at certain times. Ilog defines six logging levels: Error, Warning, Notice, Info, Debug, and Trace, with levels ‘error’, ‘warning’ and ‘notice’ being written to /var/log/messages with the default configuration. The user interface to kernel Ilog is through sysctl variables, each of which can be set to any combination of the logging levels.

Userspace ilog, while conceptually similar to the kernel implementation, lacks single memory space and per-boot permanence of sysctl variables. User-space processes may start and terminate arbitrarily, and there may also be multiple processes running for a given service or app. Consequently, user-space ilog uses a gconfig file and shared memory to implement run-time changes to logging levels.

Runtime control of OneFS services’ logging is via the ‘isi_ilog’ CLI tool, which enables:

  • Adjusting logging levels
  • Defining tags which enable log lines with matching tags
  • Logging by file or file and line number
  • Adding or disabling logging to a file
  • Enabling or disabling logging to syslog
  • Throttling of logging so repeated messages aren’t emitted more than N seconds apart.

For userspace log, when an application or service using ilog starts up, its logging settings are loaded from the ilog gconfig tree, and a small chunk of shared memory is opened and logically linked to that config. When ilog’s logging configuration is modified via the CLI, the gconfig tree is updated and a counter in the shared memory incremented.

The OneFS applications and services that are currently integrated with ilog include:

Service Daemons
API PAPI, isi_rsapi_d
Audit isi_audit_d, isi_audit_syslog, isi_audit_purge_helper
Backend network isi_lbfo_d
CloudPools isi_cpool_d
Cluster monitoring isi_array_d, isi_paxos
Configuration store isi_tardis_d, isi_tardis_gcfg_d
DNS isi_dnsiq_d   isi_cbind_d
Drive isi_drive_d, isi_drive_repurpose_d
Diagnostics isi_diags_d
Fast delete isi_trash_d
Healthchecks isi_protohealth_d
IPMI management isi_ipmi_mgmt_d
Migration isi_vol_copy, isi_retore
NDMP Backup isi_ndmp_d
NFS isi_nfs_convert, isi_netgroup_d
Remote assist isi_esrs_d, isi_esrs_api
SED Key Manager isi_km_d
Services manager isi_mcp_d
SmartLock Compliance isi_comp_d
SmartSync isi_dm_d
SyncIQ siq_bandwidth, siq_generator, siq_pworker, siq_pworker_hasher, siq_stf_diff, siq_sworker, siq_sworker_hasher, siq_sworker_tmonitor, siq_coord, siq_sched, siq_sched_rotate_reports
Upgrade Signing isi_catalog_init

The ilog logging level provides for three types of capabilities:

  1. Severity (which maps to syslog severity)
  2. Special
  3. Custom

Plus the ilog severity level settings are as follows: 

Ilog Severity Level Syslog Mapping
IL_FATAL Maps to LOG_CRIT. Calls exit after message is logged.
IL_ERR Maps to LOG_ERR
IL_NOTICE Maps to LOG_INFO
IL_INFO Maps to LOG_INFO
IL_DEBUG Maps to LOG_DEBUG
IL_TRACE Maps to LOG_DEBUG

For example, the following CLI command will set the NDMP service to log at the ‘info’ level:

# isi_ilog -a isi_ndmp_d --level info

Note that logging levels do not work quite like syslog, as each level is separate. Specifically, if an application’s criteria set to log messages with the ‘IL_DEBUG level’ it will only log those debug messages, and not log messages at any higher severity. To log at a level and all higher severity levels, ilog allows ‘PLUS’ (–level <level>+)  combination settings.

Logging configuration is per named application, not per process, and settings are managed on a per-node basis. Any cluster-wide ilog criteria changes will require the use of the ‘isi_for_array’ CLI utility.

Be aware that syslog is still the standard target for logging and  /etc/mcp/templates/syslog.conf (rather than /etc/syslog.conf) is used to enable sysloging. If ‘use_syslog’ is set to true, but syslog.conf is not modified, syslog entries will not be created. When syslog is enabled, if ‘log_file’ points to the same syslog file, duplicate log entries will occur, one from syslog and one from the log file.

Other isi_log CLI commands include:

List all apps:

# isi_ilog -L

Print settings for an app:

# isi_ilog -a <service_name> -p

Set application level to info:

# isi_ilog -a <service_name> --level info

Turn off syslog logging for application:

# isi_ilog -a <service_name> --syslog off

Turn on logging to a file for a service:

# isi_ilog -a <service_name> --file /ifs/logs/<service_name>.log

Of the various services that use ilog, OneFS auditing is among the most popular. As such, it has its own configuration through the ‘isi audit’ CLI command set, or from the WebUI via Cluster management > Auditing:

Additionally, the ‘audit setting global’ CLI command allows is used to enable and disable cluster auditing, as well as configure retention periods, remote CEE and syslog services, etc.

# isi audit settings global view

Protocol Auditing Enabled: Yes

            Audited Zones: System, az1

          CEE Server URIs: -

                 Hostname:

  Config Auditing Enabled: Yes

    Config Syslog Enabled: Yes

    Config Syslog Servers: 10.20.40.240

  Protocol Syslog Servers: 10.20.40.240

     Auto Purging Enabled: No

         Retention Period: 180

Additionally, the various audit event attributes can be viewed and modified via the ‘isi audit settings’ CLI command.

# isi audit settings view

            Audit Failure: create_file, create_directory, open_file_write, open_file_read, close_file_unmodified, close_file_modified, delete_file, delete_directory, rename_file, rename_directory, set_security_file, set_security_directory

            Audit Success: create_file, create_directory, open_file_write, open_file_read, close_file_unmodified, close_file_modified, delete_file, delete_directory, rename_file, rename_directory, set_security_file, set_security_directory

      Syslog Audit Events: create_file, create_directory, open_file_write, open_file_read, close_file_unmodified, close_file_modified, delete_file, delete_directory, rename_file, rename_directory, set_security_file, set_security_directory

Syslog Forwarding Enabled: Yes

To configure syslog forwarding, review the zone specific audit settings and ensure syslog audit events (for local) are set and syslog forwarding is enabled (for remote).

Note that the ‘isi audit settings’ CLI command defaults to the ‘system’ zone unless the ‘–zone’ flag is specified. For example, to view the configuration for the ‘az1’ access zone, which in this case is set to non-forwarding:

# isi audit settings view --zone=az1

            Audit Failure: create_file, create_directory, open_file_write, open_file_read, close_file_unmodified, close_file_modified, delete_file, delete_directory, rename_file, rename_directory, set_security_file, set_security_directory

            Audit Success: create_file, create_directory, open_file_write, open_file_read, close_file_unmodified, close_file_modified, delete_file, delete_directory, rename_file, rename_directory, set_security_file, set_security_directory

      Syslog Audit Events: create_file, create_directory, open_file_write, open_file_read, close_file_unmodified, close_file_modified, delete_file, delete_directory, rename_file, rename_directory, set_security_file, set_security_directory

Syslog Forwarding Enabled: No

The cluster’s /etc/syslog.conf file should include the IP address of the server that’s being forwarded to (in this example, a Linux box at 10.20.40.240):

!audit_config

*.*                                             /var/log/audit_config.log

*.*                                             @10.20.40.240

!audit_protocol

*.*                                             /var/log/audit_protocol.log

*.*                                             @10.20.40.240

Output on the remote host will be along the lines of:

Jul 31 17:46:40 isln-tme-1(id1) audit_protocol[2188] S-1-22-1-0|0|System|1|10.20.40.1|SMB|OPEN|SUCCESS|1442207|FILE|CREATED|4314890714|/ifs/test/audit_test2.doc

Jul 31 17:46:43 isln-tme-1(id1) audit_protocol[2188] S-1-22-1-0|0|System|1|10.20.40.1|SMB|CLOSE|SUCCESS|FILE|0:0|0:0|4314890714|/ifs/test/audit_test2.doc

Jul 31 17:46:43 isln-tme-1(id1) audit_protocol[2188] S-1-22-1-0|0|System|1|10.20.40.1|SMB|OPEN|SUCCESS|129|FILE|OPENED|4314890714|/ifs/test/audit_test2.doc

Jul 31 17:46:43 isln-tme-1(id1) audit_protocol[2188] S-1-22-1-0|0|System|1|10.20.40.1|SMB|CLOSE|SUCCESS|FILE|0:0|0:0|4314890714|/ifs/test/audit_test2.doc.txt

Jul 31 17:46:43 isln-tme-1(id1) audit_protocol[2188] S-1-22-1-0|0|System|1|10.20.40.1|SMB|RENAME|SUCCESS|FILE|4314890714|/ifs/test/ audit_test2.doc.txt|/ifs/test/audit_test.txt

Jul 31 17:46:44 isln-tme-1(id1) audit_protocol[2188] S-1-22-1-0|0|System|1|10.20.40.1|SMB|OPEN|FAILED:3221225524|129|FILE|DOES_NOT_EXIST||/ifs/test/audit_test2.doc

Jul 31 17:46:45 isln-tme-1(id1) audit_protocol[2188] S-1-22-1-0|0|System|1|10.20.40.1|SMB|CLOSE|SUCCESS|FILE|0:0|0:0|4314890714|/ifs/test/audit_test2.doc

Jul 31 17:46:45 isln-tme-1(id1) audit_protocol[2188] S-1-22-1-0|0|System|1|10.20.40.1|SMB|OPEN|SUCCESS|1179785|FILE|OPENED|4314890714|/ifs/test/audit_test3.txt

Jul 31 17:46:45 isln-tme-1 (id1) audit_protocol[2188] S-1-22-1-0|0|System|1|10.20.40.1|SMB|CLOSE|SUCCESS|FILE|0:0|0:0|4314890714|/ifs/test/audit_test3.txt

Jul 31 17:46:45 isln-tme-1 syslogd last message repeated 6 times

Jul 31 17:46:51 isln-tme-1 (id1) audit_protocol[2188] S-1-22-1-0|0|System|1|10.20.40.1|SMB|OPEN|SUCCESS|1180063|FILE|OPENED|4314890714|/ifs/test/audit_test3.txt

Jul 31 17:46:51 isln-tme-1 (id1) audit_protocol[2188] S-1-22-1-0|0|System|1|10.20.40.1|SMB|CLOSE|SUCCESS|FILE|0:0|0:0|4314890714|/ifs/test/audit_test3.txt

Jul 31 17:46:51 isln-tme-1(id1) audit_protocol[2188] S-1-22-1-0|0|System|1|10.20.40.1|SMB|CLOSE|SUCCESS|FILE|0:0|5:1|4314890714|/ifs/test/audit_test3.txt