OneFS Job Engine and Parallel Restriping – Part2

The Job Engine resource monitoring and execution framework allows jobs to be throttled based on both CPU and disk I/O metrics. The granularity of the resource utilization monitoring data provides the coordinator process with visibility into exactly what is generating IOPS on any particular drive across the cluster. This level of insight allows the coordinator to make very precise determinations about exactly where and how impact control is best applied. As we will see, the coordinator itself does not communicate directly with the worker threads, but rather with the director process, which in turn instructs a node’s manager process for a particular job to cut back threads.

For example, if the job engine is running a low-impact job and CPU utilization drops below the threshold, the worker thread count is gradually increased up to the maximum defined by the ‘low’ impact policy threshold. If client load on the cluster suddenly spikes for some reason, then the number of worker threads is gracefully decreased. The same principal applies to disk I/O, where the job engine will throttle back in relation to both IOPS as well as the number of I/O operations waiting to be processed in any drive’s queue. Once client load has decreased again, the number of worker threads is correspondingly increased to the maximum ‘low’ impact threshold.

In summary, detailed resource utilization telemetry allows the job engine to automatically tune its resource consumption to the desired impact level and customer workflow activity.

Certain jobs, if left unchecked, could consume vast quantities of a cluster’s resources, contending with and impacting client I/O. To counteract this, the Job Engine employs a comprehensive work throttling mechanism which is able to limit the rate at which individual jobs can run. Throttling is employed at a per-manager process level, so job impact can be managed both granularly and gracefully.

Every twenty seconds, the coordinator process gathers cluster CPU and individual disk I/O load data from all the nodes across the cluster. The coordinator uses this information, in combination with the job impact configuration, to decide how many threads may run on each cluster node to service each running job. This can be a fractional number, and fractional thread counts are achieved by having a thread sleep for a given percentage of each second.

Using this CPU and disk I/O load data, every sixty seconds the coordinator evaluates how busy the various nodes are and makes a job throttling decision, instructing the various job engine processes as to the action they need to take. This enables throttling to be sensitive to workloads in which CPU and disk I/O load metrics yield different results. Additionally, there are separate load thresholds tailored to the different classes of drives utilized in OneFS powered clusters, including high speed SAS drives, lower performance SATA disks and flash-based solid-state drives (SSDs).

The Job engine allocates a specific number of threads to each node by default, thereby controlling the impact of a workload on the cluster. If little client activity is occurring, more worker threads are spun up to allow more work, up to a predefined worker limit. For example, the worker limit for a low-impact job might allow one or two threads per node to be allocated, a medium-impact job from four to six threads, and a high-impact job a dozen or more. When this worker limit is reached (or before, if client load triggers impact management thresholds first), worker threads are throttled back or terminated.

For example, a node has four active threads, and the coordinator instructs it to cut back to three. The fourth thread is allowed to finish the individual work item it is currently processing, but then quietly exit, even though the task as a whole might not be finished. A restart checkpoint is taken for the exiting worker thread’s remaining work, and this task is returned to a pool of tasks requiring completion. This unassigned task is then allocated to the next worker thread that requests a work assignment, and processing continues from the restart check-point. This same mechanism applies in the event that multiple jobs are running simultaneously on a cluster.

Not all OneFS Job Engine jobs run equally fast. For example, a job which is based on a file system tree walk will run slower on a cluster with a very large number of small files than on a cluster with a low number of large files.  Jobs which compare data across nodes, such as Dedupe, will run more slowly where there are many more comparisons to be made.  Many factors play into this, and true linear scaling is not always possible. If a job is running slowly the first step is to discover what the specific context of the job is.

There are four main methods for jobs, and their associated processes, to interact with the file system:

Method Description
LIN Scan Via metadata, using a LIN scan. An example of this is the IntegrityScan restriping job, when performing an on-line file system verification.
Tree Walk Traversing the directory structure directly via a tree walk. For example, the SmartPoolsTree restriping job, when enacting file pool policies on a filesystem subtree.
Drive Scan Directly accessing the underlying cylinder groups and disk blocks, via a linear drive scan. For example, the MediaScan restriping job, when looking for bad disk sectors.
Changelist For example, the FilePolicy restriping job, which, in conjunction with IndexUpdate, runs an efficient SmartPools file pool policy job.

Each of these approaches has its fortes and drawbacks and will suit particular jobs. The specific access method influences the run time of a job. For instance, some jobs are unaffected by cluster size, others slow down or accelerate with the more nodes a cluster has, and some are highly influenced by file counts and directory depths.

For a number of jobs, particularly the LIN-based ones, the job engine will provide an estimated percentage completion of the job during runtime (see figure 20 below).

With LIN scans, even though the metadata is of variable size, the job engine can fairly accurately predict how much effort will be required to scan all LINs. The data, however, can be of widely-variable size, and so estimates of how long it will take to process each task will be a best reasonable guess.

For example, the job engine might know that the highest LIN is 1:0009:0000. Assuming the job will start with a single thread on each of three nodes, the coordinator evenly divides the LINs into nine ranges: 1:0000:0000-1:0000:ffff, 1:0001:0000-1:0001:ffff, etc., through 1:0008:0000-1:0009:0000. These nine tasks would then be divided between the three nodes. However, there is no guaranty that each range will take the same time to process. For example, the first range may have fewer actual LINs, as a result of old LINs having been deleted, so complete unexpectedly fast. Perhaps the third range contains a disproportional number of large files and so takes longer to process. And maybe the seventh range has heavy contention with client activity, also resulting in an increased execution time. Despite such variances, the splitting and redistribution of tasks across the node manager processes alleviates this issue, mitigating the need for perfectly-fair divisions at the onset.

Priorities play a large role in job initiation and it is possible for a high priority job to significantly impact the running of other jobs.  This is by design, since FlexProtect should be able to run with a greater level of urgency than SmartPools, for example. However, sometimes this can be an inconvenience, which is why the storage administrator has the ability to manually control the impact level and relative priority of jobs.

Certain jobs like FlexProtect have a corresponding job provided with a name suffixed by ‘Lin’, for example FlexProtectLin. This indicates that the job will automatically, where available, use an SSD-based copy of metadata to scan the LIN tree, rather than the drives themselves. Depending on the workflow, this will often significantly improve job runtime performance.

In situations where the job engine sees the available capacity on one or more disk pools fall below a low space threshold, it engages low space mode. This enables space-saving jobs to run and reclaim space before the job engine or even the cluster become unusable. When the job engine is in low-space mode new jobs will not be started, and any jobs that are not space-saving will be paused. Once free space returns above the low-space threshold, jobs that have been paused for space are resumed.

The space-saving jobs are:

  • AutoBalance(LIN)
  • Collect
  • MultiScan
  • ShadowStoreDelete
  • SnapshotDelete
  • TreeDelete

Once the cluster is no longer space constrained, any paused jobs are automatically resumed.

Until OneFS 9.7, the Job Engine had two clearly defined ‘exclusion sets’ for classes of jobs that could potentially cause performance or data integrity issues if run together. These exclusion sets help ensure that job phases with overlapping exclusion sets do not run and the same time, and the lowest priority job will be waiting.
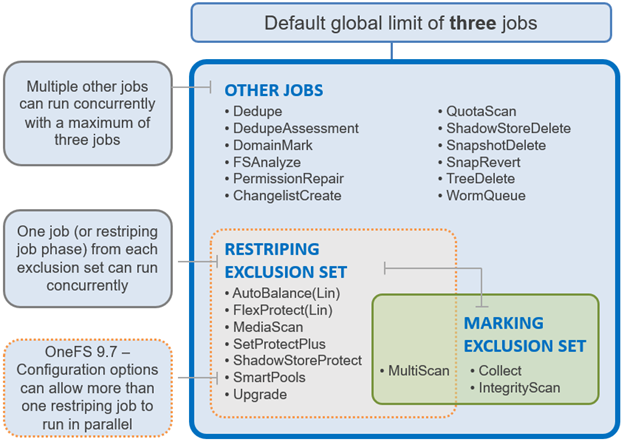
The first of these is the Marking exclusion set, which includes Collect and Integrity Scan which is strictly enforced since OneFS can only permit a single mark job without running the risk of corruption.

The other is the Restripe exclusion set, and the focus of this Job Engine enhancement. The restripe set are the jobs that move /ifs data blocks around for repair, balance, tiering, etc, in a process known as ‘restriping’ in the OneFS vernacular. These jobs include FlexProtect, MediaScan, AutoBalance, and SmartPools plus its sidekick, FilePolicy. Restriping typically has three specific goals:

Goal Description
Repair Ensures that files have the proper protection after the loss of a storage device.
Reprotect Moves files and reprotects them based on their file pool policy, while repairing at the same time, if needed.
Rebalance Ensures the correct placement of a files’ blocks to balance the drives based on the file’s policy and protection settings.

The fundamental responsibility of the jobs within the Restripe exclusion set is to ensure that the data on /ifs is protected at the desired level, balanced across nodes, and properly accounted for. It does this by running various file system maintenance jobs either manually, via a predefined schedule, or based on a cluster event, like a group change. These jobs include:

Multiscan

The MultiScan job, which combines the functionality of AutoBalance and Collect, is automatically run after a group change which adds a device to the cluster. AutoBalance(Lin) and/or Collect are only run manually if MultiScan has been disabled.

In addition to group change notifications, MultiScan is also started when:

  • Data is unbalanced within one or more disk pools, which triggers MultiScan to start the AutoBalance phase only.
  • When drives have been unavailable for long enough to warrant a Collect job, which triggers MultiScan to start both its AutoBalance and Collect phases.

AutoBalance

The goal of the AutoBalance job is to ensure that each node has the same amount of data on it, in order to balance data evenly across the cluster. AutoBalance, along with the Collect job, is run after any cluster group change, unless there are any storage nodes in a “down” state.

Upon visiting each file, AutoBalance performs the following two operations:

  • File level rebalancing
  • Full array rebalancing

For file level rebalancing, AutoBalance evenly spreads data across the cluster’s nodes in order to achieve balance within a particular file. And with full array rebalancing, AutoBalance moves data between nodes to achieve an overall cluster balance within a 5% delta across nodes.

There is also an AutoBalanceLin job available, which can be run in place of by AutoBalance when the cluster has a metadata copy available on SSD, providing an expedited job runtime. The following CLI syntax will enable the AutoBalanceLin job:

# isi_gconfig -t job-config jobs.common.lin_based_jobs=True

Collect

The Collect job is responsible for locating unused inodes and data blocks across the file system. Collect runs by default after a cluster group change, in conjunction with AutoBalance, as part of the MultiScan job.

In its first phase, Collect performs a marking job, scanning all the inodes (LINs) and identifying their associated blocks. Collect marks all the blocks which are currently allocated and in use, and any unmarked blocks are identified as candidates to be freed for reuse, so that the disk space they occupy can be reclaimed and re-allocated. All metadata must be read in this phase in order to mark every reference, and must be done completely, to avoid sweeping in-use blocks and introducing allocation corruption.

Collect’s second phase scans all the cluster’s drives and performs the freeing up, or sweeping, of any unmarked blocks so that they can be reused.

MediaScan

MediaScan’s role within the file system protection framework is to periodically check for and resolve drive bit errors across the cluster. This proactive data integrity approach helps guard against a phenomenon known as ‘bit rot’, and the resulting specter of hardware induced silent data corruption.

MediaScan is run as a low-impact, low-priority background process, based on a predefined schedule (monthly, by default).

First, MediaScan’s search and repair phase checks the disk sectors across all the drives in a cluster and, where necessary, utilizes OneFS’ dynamic sector repair (DSR) process to resolve any ECC sector errors that it encounters. For any ECC errors which can’t immediately be repaired, MediaScan will first try to read the disk sector again several times in the hopes that the issue is transient, and the drive can recover. Failing that, MediaScan will attempt to restripe files away from irreparable ECCs. Finally, the MediaScan summary phase generates a report of the ECC errors found and corrected.

IntegrityScan

The IntegrityScan job is responsible for examining the entire live file system for inconsistencies. It does this by systematically reading every block and verifying its associated checksum. Unlike traditional ‘fsck’ style file system integrity checking tools, IntegrityScan is designed to run while the cluster is fully operational, thereby removing the need for any downtime. In the event that IntegrityScan detects a checksum mismatch, it generates and alert, logs the error to the IDI logs and provides a full report upon job completion.

IntegrityScan is typically run manually if the integrity of the file system is ever in doubt. Although the job itself may take several days or more to complete, the file system is online and completely available during this time. Additionally, like all phases of the OneFS job engine, IntegrityScan can be prioritized, paused or stopped, depending on the impact to cluster operations.

FlexProtect

The FlexProtect job is responsible for maintaining the appropriate protection level of data across the cluster.  For example, it ensures that a file which is configured to be protected at +2n, is actually protected at that level. Given this, FlexProtect is arguably the most critical of the OneFS maintenance jobs because it represents the Mean-Time-To-Repair (MTTR) of the cluster, which has an exponential impact on MTTDL. Any failures or delay has a direct impact on the reliability of the OneFS file system.

In addition to FlexProtect, there is also a FlexProtectLin job. FlexProtectLin is run by default when there is a copy of file system metadata available on solid state drive (SSD) storage. FlexProtectLin typically offers significant runtime improvements over its conventional disk based counterpart.

As such, the primary purpose of FlexProtect is to repair nodes and drives which need to be removed from the cluster. In the case of a cluster group change, for example the addition or subtraction of a node or drive, OneFS automatically informs the job engine, which responds by starting a FlexProtect job. Any drives and/or nodes to be removed are marked with OneFS’ ‘restripe_from’ capability. The job engine coordinator notices that the group change includes a newly-smart-failed device and then initiates a FlexProtect job in response.

FlexProtect falls within the job engine’s restriping exclusion set and, similar to AutoBalance, comes in two flavors: FlexProtect and FlexProtectLin.

Run automatically after a drive or node removal or failure, FlexProtect locates any unprotected files on the cluster, and repairs them as rapidly as possible.  The FlexProtect job runs by default with an impact level of ‘medium’ and a priority level of ‘1’, and includes six distinct job phases:

The regular version of FlexProtect has the following phases:

Job Phase Description
Drive Scan Job engine scans the disks for inodes needing repair. If an inode needs repair, the job engine sets the LIN’s ‘needs repair’ flag for use in the next phase.


LIN Verify This phase scans the OneFS LIN tree to addresses the drive scan limitations.
LIN Re-verify The prior repair phases can miss protection group and metatree transfers. FlexProtect may have already repaired the destination of a transfer, but not the source. If a LIN is being restriped when a metatree transfer, it is added to a persistent queue, and this phase processes that queue.


Repair LINs with the ‘needs repair’ flag set are passed to the restriper for repair. This phase needs to progress quickly and the job engine workers perform parallel execution across the cluster.
Check This phase ensures that all LINs were repaired by the previous phases as expected.
Device Removal The successfully repaired nodes and drives that were marked ‘restripe from’ at the beginning of phase 1 are removed from the cluster in this phase. Any additional nodes and drives which were subsequently failed remain in the cluster, with the expectation that a new FlexProtect job will handle them shortly.

Be aware that prior to OneFS 8.2, FlexProtect is the only job allowed to run if a cluster is in degraded mode, such as when a drive has failed, for example. Other jobs will automatically be paused and will not resume until FlexProtect has completed and the cluster is healthy again. In OneFS 8.2 and later, FlexProtect does not pause when there is only one temporarily unavailable device in a disk pool, when a device is smartfailed, or for dead devices.

The FlexProtect job executes in userspace and generally repairs any components marked with the ‘restripe from’ bit as rapidly as possible. Within OneFS, a LIN Tree reference is placed inside the inode, a logical block. A B-Tree describes the mapping between a logical offset and the physical data blocks:
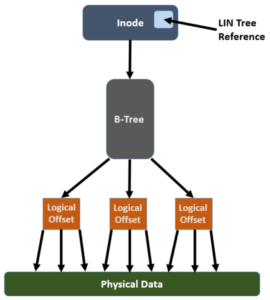
In order for FlexProtect to avoid the overhead of having to traverse the whole way from the LIN Tree reference -> LIN Tree -> B-Tree -> Logical Offset -> Data block, it leverages the OneFS construct known as the ‘Width Device List’ (WDL). The WDL enables FlexProtect to perform fast drive scanning of inodes because the inode contents are sufficient to determine need for restripe. The WDL keeps a list of the drives in use by a particular file, and are stored as an attribute within an inode and are thus protected by mirroring. There are two WDL attributes in OneFS, one for data and one for metadata. The WDL is primarily used by FlexProtect to determine whether an inode references a degraded node or drive. It New or replaced drives are automatically added to the WDL as part of new allocations.

As mentioned previously, the FlexProtect job has two distinct variants. In the FlexProtectLin version of the job the Disk Scan and LIN Verify phases are redundant and therefore removed, while keeping the other phases identical. FlexProtectLin is preferred when at least one metadata mirror is stored on SSD, providing substantial job performance benefits.

In addition to automatic job execution after a drive or node removal or failure, FlexProtect can also be initiated on demand. The following CLI syntax will kick of a manual job run:

# isi job start flexprotect
Started job [274]

# isi job list
ID   Type        State   Impact  Pri  Phase  Running Time
----------------------------------------------------------
274  FlexProtect Running Medium  1    1/6    4s
----------------------------------------------------------
Total: 1

The FlexProtect job’s progress can be tracked via a CLI command as follows:

# isi job jobs view 274
               ID: 274
             Type: FlexProtect
            State: Succeeded
           Impact: Medium
           Policy: MEDIUM
              Pri: 1
            Phase: 6/6
       Start Time: 2020-12-04T17:13:38
     Running Time: 17s
     Participants: 1, 2, 3
         Progress: No work needed
Waiting on job ID: -
      Description: {"nodes": "{}", "drives": "{}"}

Upon completion, the FlexProtect job report, detailing all six stages, can be viewed by using the following CLI command with the job ID as the argument:

# isi job reports view <job_id>
OneFS Job Engine and Parallel Restriping

One of the cluster’s functional areas that sees feature enhancement love in the new OneFS 9.7 release is the Job Engine. Specifically, the ability to support multiple restriping jobs.

As you’re probably aware, the Job Engine is a OneFS service, or daemon, that runs cluster housekeeping jobs, storage services, plus a variety of user initiated data management tasks. As such, the Job Engine performs a diverse and not always complimentary set of roles. On one hand it attempts to keeps the cluster healthy and balanced, while mitigating performance impact, and still allowing customers to perform on-demand large parallel, cluster-wide deletes, full-tree permissions management, data tiering, etc.

At a high level, this new OneFS 9.7 parallel restriping feature enables the Job Engine to run multiple restriping jobs at the same time. Restriping in OneFS is the process whereby filesystem blocks are moved around for repair, balance, tiering, etc. These restriping jobs include FlexProtect, MediaScan, AutoBalance, MultiScan, SmartPools, etc.

As such, an example of parallel restring could be running SmartPools alongside MultiScan, helping to unblock a data tiering workflow which was stuck behind an important cluster maintenance job. The following OneFS 9.7 example shows the FlexProtectLin, MediaScan, and SmartPools restriping jobs running concurrently:

# isi job jobs list

ID   Type           State   Impact  Policy  Pri  Phase  Running Time

---------------------------------------------------------------------

2273 MediaScan      Running Low     LOW     8    1/8    7h 57m

2275 SmartPools     Running Low     LOW     6    1/2    9m 44s

2305 FlexProtectLin Running Medium  MEDIUM  1    1/4    10s

---------------------------------------------------------------------

Total: 3

By way of contrast, in releases prior to OneFS 9.7, only a single restriping job can run at any point in time. Any additional restriping jobs are automatically places in a ‘waiting state’. But before getting into the details of the parallel restriping feature, a quick review of the Job Engine, and its structure and function could be useful.

In OneFS, the Job Engine runs across the entire cluster and is responsible for dividing and conquering large storage management and protection tasks. To achieve this, it reduces a task into smaller work items and then allocates, or maps, these portions of the overall job to multiple worker threads on each node. Progress is tracked and reported on throughout job execution and a detailed report and status is presented upon completion or termination.

A comprehensive check-pointing system allows jobs to be paused and resumed, in addition to stopped and started. Additionally, the Job Engine also includes an adaptive impact management system, CPU and drive-sensitive impact control, and the ability to run up to three jobs at once.

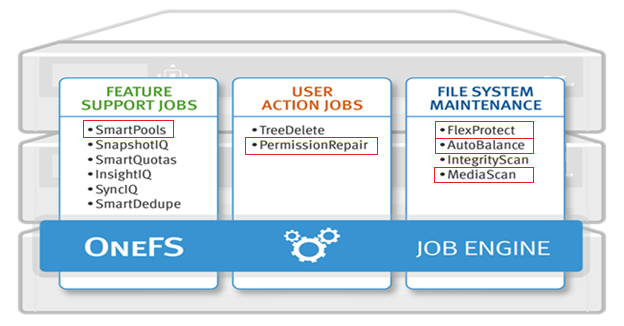
Jobs are executed as background tasks across the cluster, using spare or especially reserved capacity and resources, and can be categorized into three primary classes:

Category Description
File System Maintenance Jobs These jobs perform background file system maintenance, and typically require access to all nodes. These jobs are required to run in default configurations, and often in degraded cluster conditions. Examples include file system protection and drive rebuilds.
Feature Support Jobs The feature support jobs perform work that facilitates some extended storage management function, and typically only run when the feature has been configured. Examples include deduplication and anti-virus scanning.
User Action Jobs These jobs are run directly by the storage administrator to accomplish some data management goal. Examples include parallel tree deletes and permissions maintenance.

Although the file system maintenance jobs are run by default, either on a schedule or in reaction to a particular file system event, any Job Engine job can be managed by configuring both its priority-level (in relation to other jobs) and its impact policy.

Job Engine jobs often comprise several phases, each of which are executed in a pre-defined sequence. For instance, jobs like TreeDelete comprise a single phase, whereas more complex jobs like FlexProtect and MediaScan that have multiple distinct phases.

A job phase must be completed in entirety before the job can progress to the next phase. If any errors occur during execution, the job is marked “failed” at the end of that particular phase and the job is terminated.

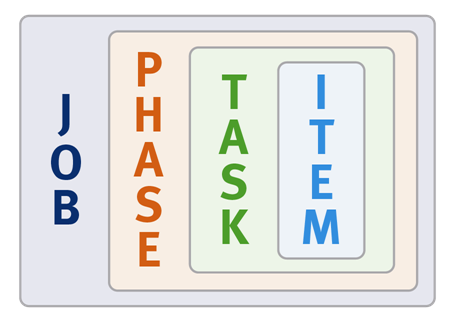
Each job phase is composed of a number of work chunks, or Tasks. Tasks, which are comprised of multiple individual work items, are divided up and load balanced across the nodes within the cluster. Successful execution of a work item produces an item result, which might contain a count of the number of retries required to repair a file, plus any errors that occurred during processing.

When a Job Engine job needs to work on a large portion of the file system, there are four main methods available to accomplish this. The most straightforward access method is via metadata, using a Logical Inode (LIN) Scan. In addition to being simple to access in parallel, LINs also provide a useful way of accurately determining the amount of work required.

A directory tree walk is the traditional access method since it works similarly to common UNIX utilities, such as find – albeit in a far more distributed way. For parallel execution, the various job tasks are each assigned a separate subdirectory tree. Unlike LIN scans, tree walks may prove to be heavily unbalanced, due to varying sub-directory depths and file counts.

Disk drives provide excellent linear read access, so a drive scan can deliver orders of magnitude better performance than a directory tree walk or LIN scan for jobs that don’t require insight into file system structure. As such, drive scans are ideal for jobs like MediaScan, which linearly traverses each node’s disks looking for bad disk sectors.

A fourth class of Job Engine jobs utilize a ‘changelist’, rather than LIN-based scanning. The changelist approach analyzes two snapshots to find the LINs which changed (delta) between the snapshots, and then dives in to determine the exact changes.

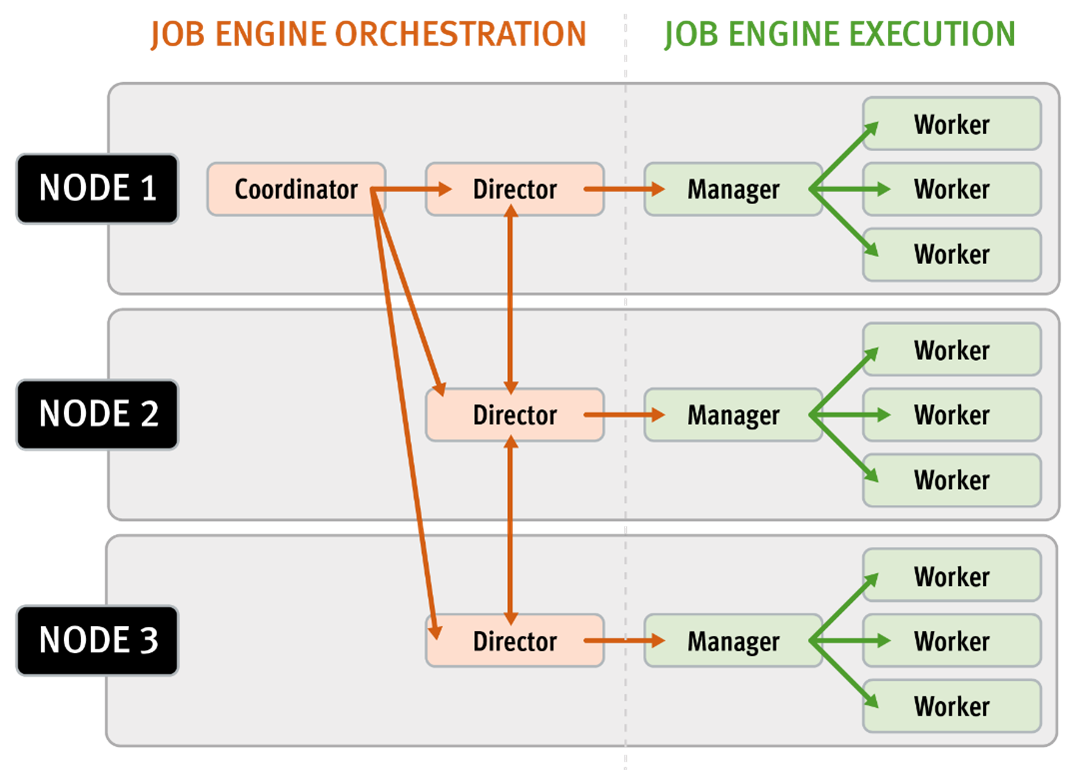
Architectural, the job engine is based on a delegation hierarchy comprising coordinator, director, manager, and worker processes.

There are other threads which are not included in the diagram above, which relate to internal functions, such as communication between the various JE daemons, and collection of statistics. Also, with three jobs running simultaneously, each node would have three manager processes, each with its own number of worker threads.

Once the work is initially allocated, the job engine uses a shared work distribution model in order to execute the work, and each job is identified by a unique Job ID. When a job is launched, whether it’s scheduled, started manually, or responding to a cluster event, the Job Engine spawns a child process from the isi_job_d daemon running on each node. This job engine daemon is also known as the parent process.

The entire job engine’s orchestration is handled by the coordinator, which is a process that runs on one of the nodes in a cluster. Any node can act as the coordinator, and the principal responsibilities include:

  • Monitoring workload and the constituent nodes’ status
  • Controlling the number of worker threads per-node and cluster-wide
  • Managing and enforcing job synchronization and checkpoints

While the actual work item allocation is managed by the individual nodes, the coordinator node takes control, divides up the job, and evenly distributes the resulting tasks across the nodes in the cluster. For example, if the coordinator needs to communicate with a manager process running on node five, it first sends a message to node five’s director, which then passes it on down to the appropriate manager process under its control. The coordinator also periodically sends messages, via the director processes, instructing the managers to increment or decrement the number of worker threads.

The coordinator is also responsible for starting and stopping jobs, and also for processing work results as they are returned during the execution of a job. Should the coordinator process die for any reason, the coordinator responsibility automatically moves to another node.

The coordinator node can be identified via the following CLI command:

# isi job status --verbose | grep Coordinator

Each node in the cluster has a job engine director process, which runs continuously and independently in the background. The director process is responsible for monitoring, governing and overseeing all job engine activity on a particular node, constantly waiting for instruction from the coordinator to start a new job. The director process serves as a central point of contact for all the manager processes running on a node, and as a liaison with the coordinator process across nodes. These responsibilities include:

  • Manager process creation
  • Delegating to and requesting work from other peers
  • Sending and receiving status messages

The manager process is responsible for arranging the flow of tasks and task results throughout the duration of a job. The manager processes request and exchange work with each other and supervise the worker threads assigned to them. At any point in time, each node in a cluster can have up to three manager processes, one for each job currently running. These managers are responsible for overseeing the flow of tasks and task results.

Each manager controls and assigns work items to multiple worker threads working on items for the designated job. Under direction from the coordinator and director, a manager process maintains the appropriate number of active threads for a configured impact level, and for the node’s current activity level. Once a job has completed, the manager processes associated with that job, across all the nodes, are terminated. And new managers are automatically spawned when the next job is moved into execution.

The manager processes on each node regularly send updates to their respective node’s director, which, in turn, informs the coordinator process of the status of the various worker tasks.

Each worker thread is given a task, if available, which it processes item-by-item until the task is complete or the manager un-assigns the task. The status of the nodes’ workers can be queried by running the CLI command “isi job statistics view”. In addition to the number of current worker threads per node, a sleep to work (STW) ratio average is also provided, giving an indication of the worker thread activity level on the node.

Towards the end of a job phase, the number of active threads decreases as workers finish up their allotted work and become idle. Nodes which have completed their work items just remain idle, waiting for the last remaining node to finish its work allocation. When all tasks are done, the job phase is considered to be complete and the worker threads are terminated.

As jobs are processed, the coordinator consolidates the task status from the constituent nodes and periodically writes the results to checkpoint files. These checkpoint files allow jobs to be paused and resumed, either proactively, or in the event of a cluster outage. For example, if the node on which the Job Engine coordinator was running went offline for any reason, a new coordinator would be automatically started on another node. This new coordinator would read the last consistency checkpoint file, job control and task processing would resume across the cluster from where it left off, and no work would be lost.

Job engine checkpoint files are stored in ‘results’ and ‘tasks’ subdirectories under the path ‘/ifs/.ifsvar/modules/jobengine/cp/<job_id>/’ for a given job. On large clusters and/or with a job running at high impact, there can be many checkpoint files accessed from all nodes, which may result in contention. Checkpoints are split into sixteen subdirectories under both tasks and results to alleviate this bottleneck.

PowerScale OneFS 9.7

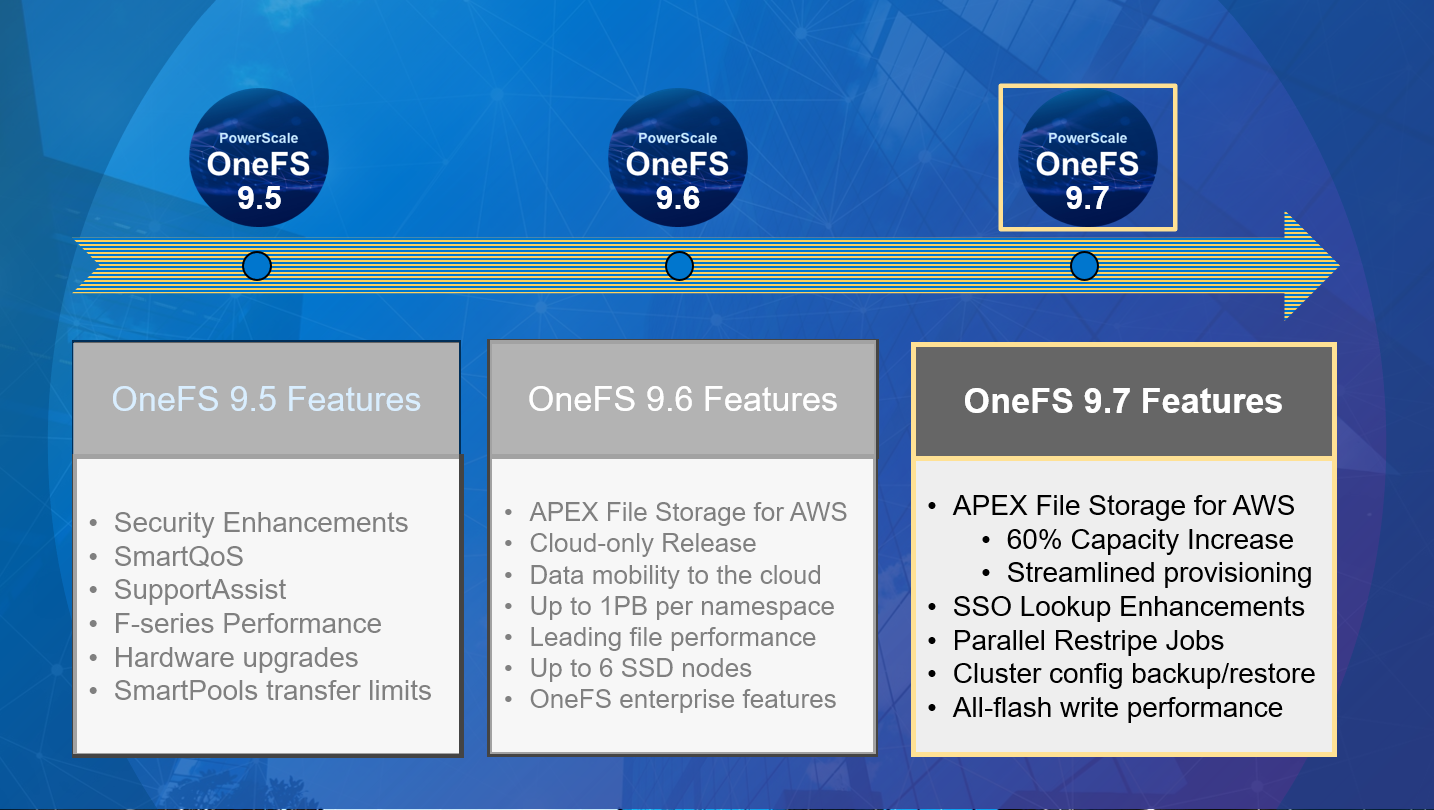
Dell PowerScale is already powering up the holiday season with the launch of the innovative OneFS 9.7 release, which shipped today (13th December 2023). This new 9.7 release is an all-rounder, introducing PowerScale innovations in cloud, performance, security, and ease of use.

Enhancements to APEX File Storage for AWS

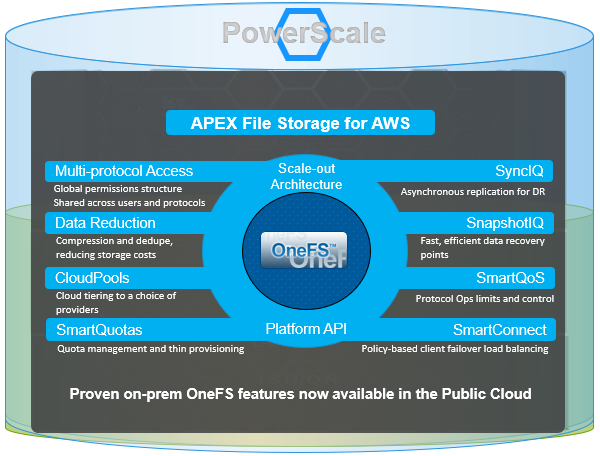
After the debut of APEX File Storage for AWS earlier this year, OneFS 9.7 extends and simplifies the PowerScale in the public cloud offering delivering more features on more instance types across more regions.

In addition to providing the same OneFS software platform on-prem and in the cloud, and customer-managed for full control, APEX File Storage for AWS in OneFS 9.7 sees a 60% capacity increase, providing linear capacity and performance scaling up to six SSD nodes and 1.6 PiB per namespace/cluster, and up to 10GB/s reads and 4GB/s writes per cluster. This can make it a solid fit for traditional file shares and home directories, vertical workloads like M&E, healthcare, life sciences, finserv, and next-gen AI, ML and analytics applications.

PowerScale’s scale-out architecture can be deployed on customer managed AWS EBS and ECS infrastructure, providing the scale and performance needed to run a variety of unstructured workflows in the public cloud. Plus, with OneFS 9.7, an ‘easy button’ for streamlined AWS infrastructure provisioning and deployment.

Once in the cloud, existing PowerScale investments can be further leveraged by accessing and orchestrating your data through the platform’s multi-protocol access and APIs.

This includes the common OneFS control plane (CLI, WebUI, and platform API), and the same enterprise features: Multi-protocol, SnapshotIQ, SmartQuotas, Identity management, etc.

With OneFS 9.7, APEX File Storage for AWS also sees the addition of support for HDFS and FTP protocols, in addition to NFS, SMB, and S3. Plus granular performance prioritization and throttling is also enabled with SmartQoS, allowing admins to configure limits on the maximum number of protocol operations that NFS, S3, SMB, or mixed protocol workloads can consume on an APEX File Storage for AWS cluster.

Security

With data integrity and protection being top of mind in this era of unprecedented cyber threats, OneFS 9.7 brings a bevy of new features and functionality to keep your unstructured data and workloads more secure than ever. These new OneFS 9.7 security enhancements help address US Federal and DoD mandates, such as FIPS 140-2 and DISA STIGs – in addition to general enterprise data security requirements. Included in the new OneFS 9.7 release is a simple cluster configuration backup and restore utility, address space layout randomization, and single sign-on (SSO) lookup enhancements.

Data mobility

On the data replication front, SmartSync sees the introduction of GCP as an object storage target in OneFS 9.7, in addition to ECS, AWS and Azure. The SmartSync data mover allows flexible data movement and copying, incremental resyncs, push and pull data transfer, and one-time file to object copy.

Performance improvements

Building on the streaming read performance delivered in a prior release, OneFS 9.7 also unlocks dramatic write performance enhancements, particularly for the all-flash NVMe platforms – plus infrastructure support for future node hardware platform generations. A sizable boost in throughput to a single client helps deliver performance for the most demanding GenAI workloads, particularly for the model training and inferencing phases. Additionally, the scale-out cluster architecture enables performance to scale linearly as GPUs are increased, allowing PowerScale to easily supports AI workflows from small to large.

Cluster support for InsightIQ 5.0

The new InsightIQ 5.0 software expands PowerScale monitoring capabilities, including a new user interface, automated email alerts and added security. InsightIQ 5.0 is available today for all existing and new PowerScale customers at no additional charge. These innovations are designed to simplify management, expand scale and security and automate operations for PowerScale performance monitoring for AI, GenAI and all other workloads.

In summary, OneFS 9.7 brings the following new features and functionality to the Dell PowerScale ecosystem:

Feature Info
Cloud ·         APEX File Storage for AWS 60% capacity increase

·         Streamlined and automated APEX provisioning and deployment

·         HDFS, FTP, and SmartQoS support

Simplicity ·         Job Engine Restripe Parallelization

·         Cluster support for InsightIQ 5.0

·         SmartSync GCP support

Performance ·         Write performance improvements for NVMe-based all-flash platforms

·         Infrastructure support for next generation all-flash node hardware platforms

Security ·         Cluster configuration backup and restore

·         Address space layout randomization

·         Single sign-on (SSO) lookup enhancements

We’ll be taking a deeper look at these new features and functionality in blog articles over the course of the next few weeks.

Meanwhile, the new OneFS 9.7 code is available on the Dell Online Support site, as both an upgrade and reimage file, allowing both installation and upgrade of this new release.

OneFS and Client Bandwidth Measurement with iPerf

Sometimes in a storage admin’s course of duty there’s a need to quickly and easily assess the bandwidth between a PowerScale cluster and client. The ubiquitous iPerf tool is a handy utility for taking active measurements of the maximum achievable bandwidth between a PowerScale cluster and client, across the node’s front-end IP network(s).

iPerf was developed by NLANR/DAST as a modern alternative for measuring maximum TCP and UDP bandwidth performance. iPerf is a flexible tool, allowing the tuning of various parameters and UDP characteristics, and reporting network performance stats including bandwidth, delay jitter, datagram loss, etc.

In addition and contrast to the classic iPerf (typically version 2.x), a newer and more feature rich iPerf3 version is also available. Unlike the classic incantation, iPerf3 is primarily developed and maintained by ESnet and the Lawrence Berkeley National Laboratory, and made available under BSD licensing. Note that iPerf3 neither shares code nor provides backwards compatibility with the classic iPerf.

Additional optional features of iPerf3 include:

  • CPU affinity setting
  • IPv6 flow labeling
  • SCTP
  • TCP congestion algorithm settings
  • Sendfile / zerocopy
  • Socket pacing
  • Authentication

Both iPerf and iPerf3 are available preinstalled on OneFS, and can be useful for measuring and verifying anticipated network performance prior to running any performance benchmark. The standard ‘iperf’ CLI command automatically invokes the classic (v2) version:

# iperf -v

iperf version 2.0.4 (7 Apr 2008) pthreads

Within OneFS, the iPerf binary can be found in the /usr/local/bin/ directory on each node:

# whereis iperf

iperf: /usr/local/bin/iperf /usr/local/man/man1/iperf.1.gz

Whereas the enhanced iPerf version 3 uses the ‘iperf3’ CLI syntax, and also lives under /usr/local/bin:

# iperf3 -v

iperf 3.4 (cJSON 1.5.2)

# whereis iperf3

iperf3: /usr/local/bin/iperf3 /usr/local/man/man1/iperf3.1.gz

For Linux and Windows clients, Iperf binaries can also be downloaded and installed from the following location:

https://iperf.fr/

The iPerf source code is also available at Sourceforge for those ‘build-your-own’ aficionados among us:

http://sourceforge.net/projects/iperf/

Under the hood, iPerf allows the configuration and tuning of a variety of buffering and timing parameters across both TCP and UDP, and with support for IPv4 and IPv6 environments. For each test, iPerf reports the maximum bandwidth, loss, and other salient metrics.

More specifically, iPerf supports the following features:

Attribute Details
TCP ·         Measure bandwidth

·         Report MSS / MTU size and observed read sizes

·         Supports SCTP multi-homing and redundant paths for reliability and resilience.

UDP ·         Client can create UDP streams of specified bandwidth

·         Measure packet loss

·         Measure delay jitter

·         Supports muti-cast

Platform support ·         Windows, Linux, MacOS, BSD UNIX, Solaris, Android, VxWorks.
Concurrency ·         Client and server can support multiple simultaneous connections (-P flag).

·         iPerf3 server accepts multiple simultaneous connections from the same client.

Duration ·         Can be configured run for a specified time (-t flag), in addition to a set amount of data (-n and -k flags).

·         Server can be run as a daemon (-D flag)

Reporting ·         Can display periodic, intermediate bandwidth, jitter, and loss reports at configurable intervals (-i flag).

When it comes to running iPerf, the most basic use case is testing a single connection from a client to a node on the cluster. This can be initiated as follows:

On the cluster node, the following CLI command will initiate the iPerf server:

# iperf -s

Similarly, on the client, the following CLI syntax will target the iPerf server on the cluster node:

# iperf -c <server_IP>

For example, with a freeBSD client with IP address 10.11.12.9 connecting to a cluster node at 10.10.11.12:

# iperf -c 10.10.11.12

------------------------------------------------------------

Client connecting to 10.10.11.12, TCP port 5001

TCP window size:   131 KByte (default)

------------------------------------------------------------

[  3] local 10.11.12.9 port 65001 connected with 10.10.11.12 port 5001

[ ID] Interval       Transfer     Bandwidth

[  3]  0.0-10.0 sec  31.8 GBytes  27.3 Gbits/sec

And from the cluster node:

# iperf -s

------------------------------------------------------------

Server listening on TCP port 5001

TCP window size:   128 KByte (default)

------------------------------------------------------------

[  4] local 10.10.11.12 port 5001 connected with 10.11.12.9 port 65001

[ ID] Interval       Transfer     Bandwidth

[  4]  0.0-10.0 sec  31.8 GBytes  27.3 Gbits/sec

As indicated in the above output, iPerf uses a default window size of 128KB. Also note that the classic iPerf (v2) uses TCP port 5001 by default on OneFS. As such, this port must be open on any and all firewalls and/or packet filters situated between client and node for the above to work. Similarly, iPerf3 defaults to TCP 5201, and the same open port requirements between clients and cluster apply.

Here’s the output from the same configuration but using iPerf3:

For example, from the server:

# iperf3 -s

-----------------------------------------------------------

Server listening on 5201

-----------------------------------------------------------

Accepted connection from 10.11.12.9, port 12543

[  5] local 10.10.11.12 port 5201 connected to 10.11.12.9 port 55439

[ ID] Interval           Transfer     Bitrate

[  5]   0.00-1.00   sec  3.22 GBytes  27.7 Gbits/sec

[  5]   1.00-2.00   sec  3.59 GBytes  30.9 Gbits/sec

[  5]   2.00-3.00   sec  3.52 GBytes  30.3 Gbits/sec

[  5]   3.00-4.00   sec  3.95 GBytes  33.9 Gbits/sec

[  5]   4.00-5.00   sec  4.07 GBytes  34.9 Gbits/sec

[  5]   5.00-6.00   sec  4.10 GBytes  35.2 Gbits/sec

[  5]   6.00-7.00   sec  4.14 GBytes  35.6 Gbits/sec

[  5]   6.00-7.00   sec  4.14 GBytes  35.6 Gbits/sec

- - - - - - - - - - - - - - - - - - - - - - - - -

[ ID] Interval           Transfer     Bitrate

[  5]   0.00-7.00   sec  27.8 GBytes  34.1 Gbits/sec                  receiver

iperf3: the client has terminated

-----------------------------------------------------------

Server listening on 5201

-----------------------------------------------------------

And from the client:

# iperf3 -c 10.10.11.12

Connecting to host 10.10.11.12, port 5201

[  5] local 10.11.12.9 port 55439 connected to 10.10.11.12 port 5201

[ ID] Interval           Transfer     Bitrate         Retr  Cwnd

[  5]   0.00-1.00   sec  3.22 GBytes  27.7 Gbits/sec    0    316 KBytes

[  5]   1.00-2.00   sec  3.59 GBytes  30.9 Gbits/sec    0    316 KBytes

[  5]   2.00-3.00   sec  3.52 GBytes  30.3 Gbits/sec    0    504 KBytes

[  5]   3.00-4.00   sec  3.95 GBytes  33.9 Gbits/sec    2    671 KBytes

[  5]   4.00-5.00   sec  4.07 GBytes  34.9 Gbits/sec    0    671 KBytes

[  5]   5.00-6.00   sec  4.10 GBytes  35.2 Gbits/sec    1    664 KBytes

[  5]   6.00-7.00   sec  4.14 GBytes  35.6 Gbits/sec    0    664 KBytes

^C[  5]   7.00-7.28   sec  1.17 GBytes  35.6 Gbits/sec    0    664 KBytes

- - - - - - - - - - - - - - - - - - - - - - - - -

[ ID] Interval           Transfer     Bitrate         Retr

[  5]   0.00-7.28   sec  27.8 GBytes  32.8 Gbits/sec    3             sender

[  5]   0.00-7.28   sec  0.00 Bytes  0.00 bits/sec                  receiver

iperf3: interrupt - the client has terminated

Regarding iPerf CLI syntax, the following options are available in each version of the tool:

Options Description iPerf iPerf3
<none> Default settings X
–authorized-users-path Path to the configuration file containing authorized users credentials to run iperf tests (if built with OpenSSL support) X
-A Set the CPU affinity, if possible (Linux, FreeBSD, and Windows only). X
-b Set target bandwidth/bitrate  to n bits/sec (default 1 Mbit/sec). Requires UDP (-u). X X
-B Bind to <host>, an interface or multicast address X X
-c Run in client mode, connecting to <host> X X
-C Compatibility; for use with older versions – does not sent extra msgs X
-C Set the congestion control algorithm (Linux and FreeBSD only) X
–cport Bind data streams to a specific client port (for TCP and UDP only, default is to use an ephemeral port) X
–connect-timeout Set timeout for establishing the initial control connection to the server, in milliseconds.  Default behavior is the OS’ timeout for TCP connection establishment. X
-d Simultaneous bi-directional bandwidth X
-d Emit debugging output X
-D Run the server as a daemon X X
–dscp Set the IP DSCP bits X
-f Format to report: Kbits/Mbits/Gbits/Tbits X
-F Input the data to be transmitted from a file X X
–forceflush Force flushing output at every interval, to avoid buffering when sending output to pipe. X
–fq-rate Set a rate to be used with fair-queueing based socket-level

pacing, in bits per second.

X
–get-server-output Get the output from the server.  The output format is determined by the server (ie. JSON ‘-j’) X
-h Help X X
-i Interval: Pause n seconds between periodic bandwidth reports. X X
-I Input the data to be transmitted from stdin X
-I Write a file with the process ID X
-J Output in JSON format X
-k Number of blocks (packets) to transmit (instead of -t or -n) X
-l Length of buffer to read or write.  For TCP tests, the default value is 128KB.  With UDP, iperf3 tries to dynamically determine a reasonable sending size based on the path MTU; if that cannot be determined it uses 1460 bytes as a sending size. For SCTP tests, the default size is 64KB. X
-L Set length read/write buffer (defaults to 8 KB) X
-L Set the IPv6 flow label X
–logfile Send output to a log file. X
-m Print TCP maximum segment size (MTU – TCP/IP header) X
-M Set TCP maximum segment size (MTU – 40 bytes) X X
-n number of bytes to transmit (instead of -t) X X
-N Set TCP no delay, disabling Nagle’s Algorithm X X
–nstreams Set number of SCTP streams. X
-o Output the report or error message to a specified file X
-O Omit the first n seconds of the test, to skip past the TCP slow-start period. X
-p Port: set server port to listen on/connect to X X
-P Number of parallel client threads to run X X
–pacing-timer Set pacing timer interval in microseconds (default 1000 microseconds, or 1 ms).  This controls iperf3’s internal pacing timer for the -b/–bitrate option. X
-r Bi-directional bandwidth X
-R Reverse the direction of a test, so that the server sends data to the client X
–rsa-private-key-path Path to the RSA private key (not password-protected) used to decrypt authentication credentials from the client (if built with OpenSSL support). X
–rsa-public-key-path Path to the RSA public key used to encrypt authentication credentials (if built with OpenSSL support) X
-s Run iPerf in server mode X X
-S Set the IP type of service. X
–sctp use SCTP rather than TCP (FreeBSD and Linux) X
-t Time in seconds to transmit for (default 10 secs) X X
-T Time-to-live, for multicast (default 1) X
-T Prefix every output line with this title string X
-u Use UDP rather than TCP. X X
-U Run in single threaded UDP mode X
–username Username to use for authentication to the iperf server (if built with OpenSSL support).  The password will be prompted for interactively when the test is run. X
-v Print version information and quit X X
-V Set the domain to IPv6 X
-V Verbose – give more detailed output X
-w TCP window size (socket buffer size) X X
-x Exclude C(connection), D(data), M(multicast), S(settings), V(server) reports X
-X Bind SCTP associations to a specific subset of links using sctp_bindx X
-y If set to C or c, report results as CSV (comma separated values) X
-Z Set TCP congestion control algorithm (Linux only) X
-Z Use a ‘zero copy’ method of sending data, such as sendfile instead of the usual write. X
-1 Handle one client connection, then exit. X
-4 Only use IPv4 X
-6 Only use Ipv6 X

To run the iPerf server across all nodes in a cluster, it can be initiated in conjunction with the OneFS ‘isi_for_array’ CLI utility, as follows:

# isi_for_array iperf -s

Bidirectional testing can also sometimes be a useful sanity-check, with OneFS acting as the client pointing to a client OS running the server instance of iPerf. For example:

# iperf -c 10.10.11.205 -i 5 -t 60 -P 4

Start the iperf client on a Linux client connecting to one of the PowerScale nodes.

# iperf -c 10.10.1.100

For a Windows client, the same CLI syntax, issued from the command shell (cmd.exe), can be used to start the iperf client and connect to a PowerScale nodes. For example:

C:\Users\pocadmin\Downloads\iperf-2.0.9-win64\iperf-2.0.9-win64>iperf.exe -c 10.10.0.196

iPerf Write Testing

When it comes to write performance testing, the following CLI syntax can be used on the client to executes a write speed (Client –> Cluster) test:

# iperf -P 8 -c <clusterIP>

Note that the ‘-P’ flag designates parallel client threads, allowing the iPerf threads to be match up with the number of physical CPU cores (not hyper-threads) available to the client.

Similarly, the following CLI command can be used on the client to initiate a read speed (Client <– Cluster) test:

# iperf -P 8 -R -c <clusterIP>

Below is an example command from a Linux VM to a single PowerScale node.  Testing was repeated from each Linux client to each node in the cluster to validate results and verify consistent network performance. Using the cluster nodes as the server, the bandwidth tested to ~ 7.2Gbps per VM. (Note that, in this case, the VM limit is 8.0 Gbps):

# iperf -c onefs-node1 -i 5 -t 60 -P 4

------------------------------------------------------------

Client connecting to isilon-node1, TCP port 5001

TCP window size: 94.5 KByte (default)

------------------------------------------------------------

[  4] local 10.10.0.205 port 44506 connected with 172.16.0.5 port 5001

[SUM]  0.0-60.0 sec  50.3 GBytes  7.20 Gbits/sec

Two Linux VMs were also testing running iPerf in parallel to maximize the ExpressRoute network link. This test involved dual iPerf writes from the Linux clients to separate cluster nodes.

[admin@Linux64GB16c-3 ~]$ iperf -c onefs-node3 -i 5 -t 40 -P 4

[SUM]  0.0-40.0 sec  22.5 GBytes  4.83 Gbits/sec 

[admin@linux-vm2 ~]$ iperf -c onefs-node2 -i 5 -t 40 -P 4

[SUM]  0.0-40.0 sec  22.1 GBytes  4.75 Gbits/sec

As can be seen from the results of the iPerf tests, writes appear to split evenly from the Linux clients to the cluster nodes, while saturating the bandwidth of its Azure ExpressRoute link.