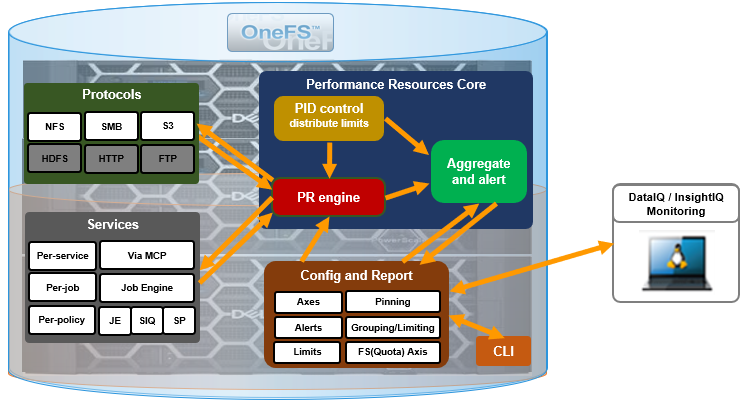
Another feature of the recent OneFS 9.3 release is enhanced performance resource monitoring for the NFS protocol, adding path tracking for NFS and bringing it up to parity with the SMB protocol resource monitoring.
But first, a quick refresher. The performance resource monitoring framework enables OneFS to track and report the use of transient system resources (ie. resources that only exists at a given instant), providing insight into who is consuming what resources, and how much of them. Examples include CPU time, network bandwidth, IOPS, disk accesses, and cache hits (but not currently disk space or memory usage). OneFS performance resource monitoring initially debuted in OneFS 8.0.1 and is an ongoing project, which ultimately will provide both insights and control. This will allow prioritization of work flowing through the system, prioritization and protection of mission critical workflows, and the ability to detect if a cluster is at capacity.
Since identification of work is highly subjective, OneFS performance resource monitoring provides significant configuration flexibility, allowing cluster admins to define exactly how they wish to track workloads. For example, an administrator might want to partition their work based on criterial like which user is accessing the cluster, the export/share they are using, which IP address they’re coming from – and often a combination of all three.
So why not just track it all, you may ask? It would simply generate too much data (potentially requiring a cluster just to monitor your cluster!).
OneFS has always provided client and protocol statistics, however they were typically front-end only. Similarly, OneFS provides CPU, cache and disk statistics, but they did not display who was consuming them. Partitioned performance unites these two realms, tracking the usage of the CPU, drives and caches, and spanning the initiator/participant barrier.
Under the hood, OneFS collects the resources consumed, grouped into distinct workloads, and the aggregation of these workloads comprise a performance dataset.
| Item | Description | Example |
| Workload | · A set of identification metrics and resources used | {username:nick, zone_name:System} consumed {cpu:1.5s, bytes_in:100K, bytes_out:50M, …} |
| Performance Dataset | · The set of identification metrics to aggregate workloads by
· The list of workloads collected matching that specification
|
{usernames, zone_names} |
| Filter | · A method for including only workloads that match specific identification metrics. | Filter{zone_name:System}
{username:nick, zone_name:System} {username:jane, zone_name:System} {username:nick, zone_name:Perf} |
The following metrics are tracked:
| Category | Items |
| Identification Metrics | · Username / UID / SID
· Primary Groupname / GID / GSID · Secondary Groupname / GID / GSID · Zone Name · Local/Remote IP Address/Range · Path* · Share / Export ID · Protocol · System Name* · Job Type |
| Transient Resources | · CPU Usage
· Bytes In/Out · IOPs · Disk Reads/Writes · L2/L3 Cache Hits |
| Performance Statistics | · Read/Write/Other Latency |
| Supported Protocols | · NFS
· SMB · S3 · Jobs · Background Services |
With the exception of the system dataset, performance datasets must be configured before statistics are collected. This is typically performed via the ‘isi performance’ CLI command set, but can also be done via the platform API:
https://<node_ip>:8080/platform/performance
Once a performance dataset has been configured, it will continue to collect resource usage statistics every 30 seconds until it is deleted. These statistics can be viewed via the ‘isi statistics’ CLI interface.
This is as simple as, first, creating a dataset specifying which identification metrics you wish to partition work by:
# isi performance dataset create --name ds_test1 username protocol export_id share_name
Next, waiting 30 seconds for data to collect.
Finally, viewing the performance dataset:
# isi statistics workload --dataset ds_test1

    CPU  BytesIn  BytesOut   Ops  Reads  Writes   L2   L3  ReadLatency  WriteLatency  OtherLatency  UserName  Protocol  ExportId  ShareName  WorkloadType

---------------------------------------------------------------------------------------------------------------------------------------------------------

 11.0ms     2.8M     887.4   5.5    0.0   393.7  0.3  0.0      503.0us       638.8us         7.4ms       nick      nfs3         1          -             -

  1.2ms    10.0K     20.0M  56.0   40.0     0.0  9.0  0.0        0.0us         0.0us         0.0us      jane      nfs3         3          -             -

  1.0ms    18.3M      17.0  10.0    0.0    47.0  0.0  0.0        0.0us       100.2us         0.0us      jane      smb2         -       home             -

 31.4us     15.1      11.7   0.1    0.0     0.0  0.0  0.0      349.3us         0.0us         0.0us       nick      nfs4         4          -             -

166.3ms      0.0       0.0   0.0    0.0     0.1  0.0  0.0        0.0us         0.0us         0.0us         -         -         -          -      Excluded

 31.6ms      0.0       0.0   0.0    0.0     0.0  0.0  0.0        0.0us         0.0us         0.0us         -         -         -          -        System

 70.2us      0.0       0.0   0.0    0.0     3.3  0.1  0.0        0.0us         0.0us         0.0us         -         -         -          -       Unknown

  0.0us      0.0       0.0   0.0    0.0     0.0  0.0  0.0        0.0us         0.0us         0.0us         -         -         -          -    Additional

  0.0us      0.0       0.0   0.0    0.0     0.0  0.0  0.0        0.0us         0.0us         0.0us         -         -         -          - Overaccounted

---------------------------------------------------------------------------------------------------------------------------------------------------------

Total: 8
Be aware that OneFS can only harvest a limited number of workloads per dataset. As such, it keeps track of the highest resource consumers, which it considers top workloads, and outputs as many of those as possible, up to a limit of either 1024 top workloads or 1.5MB memory per sample (whichever is reached first).
When you’re done with a performance dataset, it can be easily removed with the ‘isi performance dataset delete <dataset_name> syntax. For example:
# isi performance dataset delete ds_test1

Are you sure you want to delete the performance dataset.? (yes/[no]): yes

Deleted performance dataset 'ds_test1' with ID number 1.
Performance resource monitoring includes the five aggregate workloads below for special cases, and OneFS can output up to 1024 additional pinned workloads. Plus, a cluster administrator can configure up to four custom datasets, or special workloads, which can aggregate special case workloads.
| Aggregate Workload | Description |
| Additional | · Not in the ‘top’ workloads |
| Excluded | · Does not match the dataset definition (ie. missing a required metric such as export_id)
· Does not match any applied filter (See later in the slide deck) |
| Overaccounted | · Total of work that has appeared in multiple workloads within the dataset
· Can happen for datasets using path and/or group metrics |
| System | · Background system/kernel work |
| Unknown | · OneFS couldn’t determine where this work came from |
The ‘system’ dataset is created by default and cannot be deleted or renamed. Plus, it is the only dataset that includes the OneFS services and job engine’s resource metrics:
| OneFS Resource | Details |
| System service | · Any process started by isi_mcp / isi_daemon
· Any protocol (likewise) service |
| Jobs | · Includes job ID, job type, and phase |
Non-protocol work only includes CPU, cache and drive statistics, but no bandwidth usage, op counts, or latencies. Plus, protocols (ie. S3) that haven’t been fully integrated into the resource monitoring framework yet also get these basic statistics, and only in the system dataset
If no dataset is specified in an ‘isi statistics workload’ command, the ‘system’ dataset statistics are displayed by default:
# isi statistics workload
Performance workloads can also be ‘pinned’, allowing a workload to be tracked even when it’s not a ‘top’ workload, and regardless of how many resources it consumes. This can be configured with the following CLI syntax:
# isi performance workloads pin <dataset_name/id> <metric>:<value>
Note that all metrics for the dataset must be specified. For example:
# isi performance workloads pin ds_test1 username:jane protocol:nfs3 export_id:3

# isi statistics workload --dataset ds_test1

    CPU  BytesIn  BytesOut   Ops  Reads  Writes   L2   L3  ReadLatency  WriteLatency  OtherLatency  UserName  Protocol  ExportId   WorkloadType

-----------------------------------------------------------------------------------------------------------------------------------------------

 11.0ms     2.8M     887.4   5.5    0.0   393.7  0.3  0.0      503.0us       638.8us         7.4ms       nick      nfs3         1              -

  1.2ms    10.0K     20.0M  56.0   40.0     0.0  0.0  0.0        0.0us         0.0us         0.0us      jane      nfs3         3         Pinned <- Always Visible

 31.4us     15.1      11.7   0.1    0.0     0.0  0.0  0.0      349.3us         0.0us         0.0us       jim      nfs4         4              -    Workload

166.3ms      0.0       0.0   0.0    0.0     0.1  0.0  0.0        0.0us         0.0us         0.0us         -         -         -       Excluded

 31.6ms      0.0       0.0   0.0    0.0     0.0  0.0  0.0        0.0us         0.0us         0.0us         -         -         -         System

 70.2us      0.0       0.0   0.0    0.0     3.3  0.1  0.0        0.0us         0.0us         0.0us         -         -         -        Unknown

  0.0us      0.0       0.0   0.0    0.0     0.0  0.0  0.0        0.0us         0.0us         0.0us         -         -         -     Additional <- Unpinned workloads

  0.0us      0.0       0.0   0.0    0.0     0.0  0.0  0.0        0.0us         0.0us         0.0us         -         -         -  Overaccounted    that didn’t make it

-----------------------------------------------------------------------------------------------------------------------------------------------

Total: 8
Workload filters can also be configured to restrict output to just those workloads which match a specified criteria. This allows for more finely-tuned tracking, which can be invaluable when dealing with large number of workloads. Configuration is greedy, since a workload will be included if it matches any applied filter. Filtering can be implemented with the following CLI syntax:
# isi performance dataset create <all_metrics> --filters <filtered_metrics>

# isi performance filter apply <dataset_name/id> <metric>:<value>
For example:
# isi performance dataset create --name ds_test1 username protocol export_id --filters username,protocol

# isi performance filters apply ds_test1 username:nick protocol:nfs3

# isi statistics workload --dataset ds_test1

    CPU  BytesIn  BytesOut   Ops  Reads  Writes   L2   L3  ReadLatency  WriteLatency  OtherLatency  UserName  Protocol  ExportId   WorkloadType

-----------------------------------------------------------------------------------------------------------------------------------------------

 11.0ms     2.8M     887.4   5.5    0.0   393.7  0.3  0.0      503.0us       638.8us         7.4ms       nick      nfs3         1              - <- Matches Filter

 13.0ms     1.4M     600.4   2.5    0.0   200.7  0.0  0.0      405.0us       638.8us         8.2ms       nick      nfs3         7              - <- Matches Filter

167.5ms    10.0K     20.0M  56.1   40.0     0.1  0.0  0.0      349.3us         0.0us         0.0us         -         -         -       Excluded <- Aggregate of not

 31.6ms      0.0       0.0   0.0    0.0     0.0  0.0  0.0        0.0us         0.0us         0.0us         -         -         -         System    matching filter

 70.2us      0.0       0.0   0.0    0.0     3.3  0.1  0.0        0.0us         0.0us         0.0us         -         -         -        Unknown

  0.0us      0.0       0.0   0.0    0.0     0.0  0.0  0.0        0.0us         0.0us         0.0us         -         -         -     Additional

  0.0us      0.0       0.0   0.0    0.0     0.0  0.0  0.0        0.0us         0.0us         0.0us         -         -         -  Overaccounted

-----------------------------------------------------------------------------------------------------------------------------------------------

Total: 8
Be aware that the metric to filter on must be specified when creating the dataset. A dataset with a filtered metric, but no filters applied, will output an empty dataset.
As mentioned previously, NFS path tracking is the principal enhancement to OneFS 9.3 performance resource monitoring, and this can be easily enabled as follows (for both the NFS and SMB protocols:
# isi performance dataset create --name ds_test1 username path --filters=username,path
The statistics can then be viewed with the following CLI syntax (in this case for dataset ‘ds_test1’ with ID 1):
# isi statistics workload list --dataset 1
When it comes to path tracking, there are a couple of caveats and restrictions that should be considered. Firstly, with OneFS 9.3, it is now available on the NFS and SMB protocols only. Also, path tracking is expensive and OneFS cannot track every single path. The desired paths to be tracked must be listed first, and can be specified by either pinning a workload or applying a path filter
If the resource overhead of path tracking is deemed too costly, consider a possible equivalent alternative such as tracking by NFS Export ID or SMB Share, as appropriate.
Users can have thousands of secondary groups, often simply too many to track. Only the primary group will be tracked until groups are specified, so any secondary groups to be tracked must be specified first, again either by applying a group filter or pinning a workload.
Note that some metrics only apply to certain protocols, For example, ‘export_id’ only applies to NFS. Similarly, ‘share_name’ only applies to SMB. Also, note that there is no equivalent metric (or path tracking) implemented for the S3 object protocol yet. This will be addressed in a future release.
These metrics can be used individually in a dataset or combined. For example, a dataset configured with both ‘export_id’ and metrics will list both NFS and SMB workloads with either ‘export_id’ or ‘share_name’. Likewise, a dataset with only the ‘share_name’ metric will only list SMB workloads, and a dataset with just the ‘export_id’ metric will only list NFS, excluding any SMB workloads. However, if a workload is excluded it will be aggregated into the special ‘Excluded’ workload.
When viewing collected metrics, the ‘isi statistics workload’ CLI command displays only the last sample period in table format with the statistics normalized to a per-second granularity:
# isi statistics workload [--dataset <dataset_name/id>]
Names are resolved wherever possible, such as UID to username, IP address to hostname, etc, and lookup failures are reported via an extra ‘error’ column. Alternatively, the ‘—numeric’ flag can also be included to prevent any lookups:
# isi statistics workload [--dataset <dataset_name/id>] –numeric
Aggregated cluster statistics are reported by default, but adding the ‘—nodes’ argument will provide per node statistics as viewed from each initiator. More specifically, the ‘–nodes=0’ flag will display the local node only, whereas ‘–nodes=all’ will report all nodes.
The ‘isi statistics workload’ command also includes standard statistics output formatting flags, such as ‘—sort’, ‘—totalby’, etc.
    --sort (CPU | (BytesIn|bytes_in) | (BytesOut|bytes_out) | Ops | Reads |

      Writes | L2 | L3 | (ReadLatency|latency_read) |

      (WriteLatency|latency_write) | (OtherLatency|latency_other) | Node |

      (UserId|user_id) | (UserSId|user_sid) | UserName | (Proto|protocol) |

      (ShareName|share_name) | (JobType|job_type) | (RemoteAddr|remote_address)

      | (RemoteName|remote_name) | (GroupId|group_id) | (GroupSId|group_sid) |

      GroupName | (DomainId|domain_id) | Path | (ZoneId|zone_id) |

      (ZoneName|zone_name) | (ExportId|export_id) | (SystemName|system_name) |

      (LocalAddr|local_address) | (LocalName|local_name) |

      (WorkloadType|workload_type) | Error)

        Sort data by the specified comma-separated field(s). Prepend 'asc:' or

        'desc:' to a field to change the sort order.


    --totalby (Node | (UserId|user_id) | (UserSId|user_sid) | UserName |

      (Proto|protocol) | (ShareName|share_name) | (JobType|job_type) |

      (RemoteAddr|remote_address) | (RemoteName|remote_name) |

      (GroupId|group_id) | (GroupSId|group_sid) | GroupName |

      (DomainId|domain_id) | Path | (ZoneId|zone_id) | (ZoneName|zone_name) |

      (ExportId|export_id) | (SystemName|system_name) |

      (LocalAddr|local_address) | (LocalName|local_name))

        Aggregate per specified fields(s).
In addition to the CLI, the same output can be accessed via the platform API:
# https://<node_ip>:8080/platform/statistics/summary/workload
Raw metrics can also be viewed using the ‘isi statistic query’ command:
# isi statistics query <current|history> --format=json --keys=<node|cluster>.performance.dataset.<dataset_id>
Options are either ‘current’, which will provide most recent sample, or ‘history’, which will report samples collected over the last 5 minutes. Names are not looked up and statistics are not normalized – the sample period is included in the output. The command syntax must also include the ‘–format=json’ flag, since no other output formats are currently supported. Additionally, there are two distinct types of keys:
| Key Type | Description |
| cluster.performance.dataset.<dataset_id> | Cluster-wide aggregated statistics |
| node.performance.dataset.<dataset_id> | Per node statistics from the initiator perspective |
Similarly, this raw metrics can also be obtained via the platform API as follows:
https://<node_ip>:8080/platform/statistics/<current|history>?keys=node.performance.dataset.0