Since OneFS 9.10, MetadataIQ has provided PowerScale clusters with a global metadata namespace, by exporting file system metadata to an off-cluster Elasticsearch database. The ability to index and query metadata across geo-distributed clusters, without resorting to time-consuming tree walks, has proven invaluable for data discovery, lifecycle management, and increasingly for AI-driven workflows such as intelligent chunking and retrieval-augmented generation (RAG).

However, in OneFS 9.14 and earlier, when a directory was renamed on the cluster, MetadataIQ dutifully recorded the new directory entry in Elasticsearch, but every child path beneath that directory remained indexed under the old prefix. This resulted in stale entries: the database reported the files living under /ifs/data/A/B/C, but the file system had them under /ifs/data/A/Bx/C. Until the release of OneFS 9.15, the only remedy was a full resync — a brute-force re-indexing of the entire dataset that is neither performant nor automation-friendly.
The new OneFS 9.15 releases addresses this MetadataIQ shortcoming with automatic directory rename propagation. Specifically, when a directory rename is detected, the system now tracks both the old and new paths and runs a dedicated rename phase that updates all descendant entries in the Elasticsearch index, eliminating stale data without a full resync. Additionally, the schema encoding for hardlinks has been redesigned to remove path sensitivity entirely.
To understand the solution, it helps to be clear about the problem. MetadataIQ’s Elasticsearch index uses a primary key (_id) for each document. In releases prior to 9.15, this ‘_id’ was encoded as a combination of the file’s LIN (logical inode number) and a hash of its full path: <LIN>#<path_hash>.
This encoding has two consequences when a parent directory is renamed:
- Every child entry in the database retains its old path. A directory rename from /ifs/data/projects to /ifs/data/projects_2026 leaves every file and subdirectory under it still indexed with the /ifs/data/projects prefix. The database and the file system disagree, and queries return incorrect results.
- For hardlinks, the path_hash component of the _id changes when a parent is renamed, even though the file itself has not changed. This creates duplicate or orphaned entries in the index.
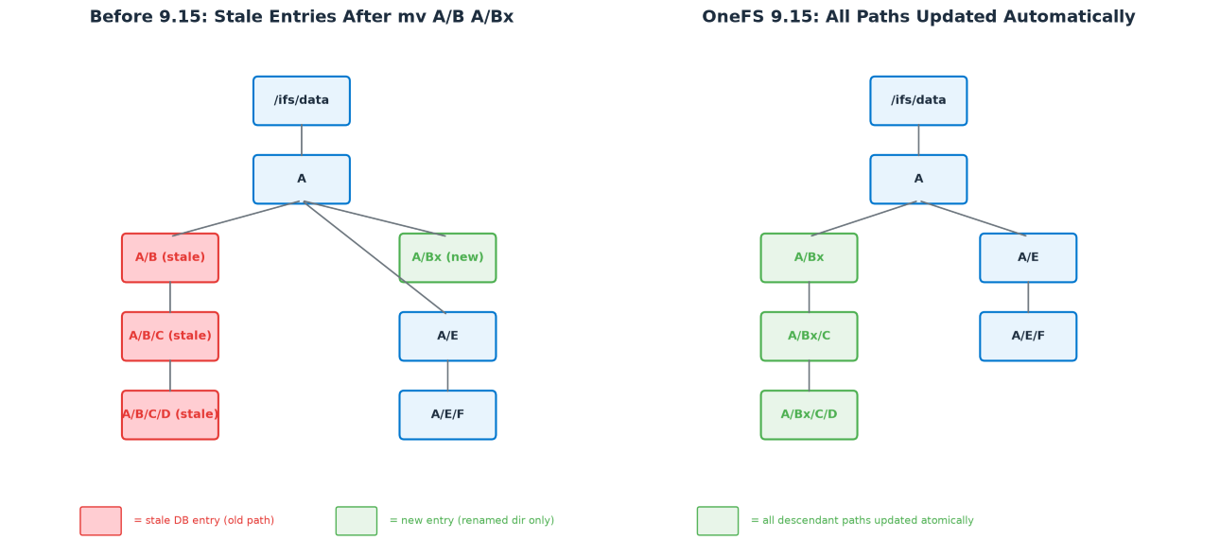
Pre-OneFS 9.15 this required an expensive resync, effectively re-indexing the full dataset.
However, to avoid this overhead, the directory rename feature in OneFS 9.15 operates within MetadataIQ’s existing transfer agent (‘isi_metadataiq_transfer’), adding a post-processing rename phase that runs after the normal changelist transfer is complete. As such, the 9.15 workflow has two distinct phases:
Phase 1: Primary Processing
During normal MetadataIQ processing, the transfer agent iterates through the changelist entries and pushes them to the Elasticsearch database. When a directory rename event is detected, the following occurs:
- The changelist entry is pushed to the database as usual, with the old path and path depth preserved.
- The new directory path is recorded in a special rename_path field on the renamed directory’s document in Elasticsearch.
- Metadata fields such as timestamp, disk pool, and node pool are updated to reflect the current file system state.
At this stage, the children of the renamed directory still have their old paths in the database. The rename_path field is a breadcrumb that tells Phase 2 which directories have pending renames.
Phase 2: Rename (Post-processing)
After all primary changelist processing is complete, the transfer agent enters the rename phase. This is where the descendant path updates happen:
- The script queries Elasticsearch for all documents that have a non-empty rename_path field — these are the directories with pending renames.
- For each rename candidate, the script identifies all descendant entries whose path begins with the old directory prefix. These are processed in descending order by path depth, ensuring that deeply nested renames are handled correctly before their parents.
- The actual path update is performed atomically using an Elasticsearch Painless script execution. A single Painless script replaces the old path prefix with the new directory path and recomputes associated metadata for all descendants. This atomic update includes:
– Path depth: adjusted by calculating the depth difference between the new and old paths.
– Snapshot generation number: updated atomically so that parent-level renames can skip entries already modified by a child-level rename.
– Other metadata fields: all relevant metadata is refreshed for every descendant entry.
- Once the root rename document and all its descendants are updated, the rename_path field is cleared, marking that rename as complete.
- This process iterates until all pending renames have been resolved.

Above, Phase 1 (blue) records rename candidates during normal changelist processing, while phase 2 (green) iterates through candidates and atomically updates all descendant paths.
Note that the descendant prefix search in Elasticsearch requires the ‘allow_expensive_queries’ setting to be enabled, which it is by default. This setting should not be disabled on MetadataIQ’s Elasticsearch instance.
The MetadataIQ transfer agent uses batched, checkpointed processing throughout both phases. An interrupted transfer resumes from the last recorded checkpoint rather than restarting from the beginning. The various stages of the transfer workflow are as follows:
| Stage | Description |
| Fetch batch | Fetch changelist entries batchwise from the PAPI server (maximum 2,048 entries per fetch) |
| Detect rename | Detect directory rename events within the batch |
| Record rename_path | Record the new path in the rename_path field; preserve the old path and path depth |
| Checkpoint | Refresh object metadata, update ‘tail_cookie’, and record a checkpoint at batch end |
| Iterate candidates | In the rename phase, iterate over each recorded directory rename candidate |
| Find descendants | Identify descendants by old path prefix, processed in descending depth order |
| Update child paths | Replace the old prefix with the new directory path and update child metadata |
| Reconcile | Clear the rename_path field, marking the subtree as fully reconciled |
| Failure exit | On crash or ElasticSearch connection failure, exit and resume from the last checkpoint |
If the transfer script exits during the rename phase, for example, in the event of a node failover, service restart, or a network interruption, the ‘rename_path’ fields in Elasticsearch remain set on any unprocessed rename candidates. When the transfer agent is next invoked, it detects these pending rename entries, skips the primary processing phase entirely, and proceeds directly to the rename phase to complete the outstanding work. No manual intervention is required. This is a significant improvement over the old full-resync approach, where an interrupted resync would simply need to be restarted from the beginning.
The second component of the directory rename feature addresses the hardlink problem at the schema level. In pre-9.15 releases, the Elasticsearch document ‘_id’ is encoded as ‘<LIN>#<path_hash>’. Since a hardlink is an additional directory entry pointing to the same inode, renaming a parent directory changes the ‘path_hash’ for every hardlink entry beneath it, creating duplicates or orphans in the index.
In OneFS 9.15, the ‘_id’ encoding for hardlinks is changed to use the parent LIN and filename rather than a full path hash. Because the filename itself does not change when a parent directory is renamed, hardlink entries are no longer sensitive to parent path changes. This eliminates an entire class of stale-entry scenarios.

The OneFS 9.14 and earlier encoding includes a hash of the full path, which changes when any ancestor is renamed. Conversely, the 9.15 encoding uses only the filename, making hardlinks immune to parent renames.
Architecturally, the rename phase is built directly into the existing MetadataIQ transfer agent. No new daemons, services, or ports are introduced. The transfer agent (‘isi_metadataiq_transfer’) already handles the mechanics of reading changelist entries, batching them, and uploading them to Elasticsearch. The rename phase simply adds a post-processing step after the draining loop completes.
There are two paths into the rename logic:
| Path | Details |
| Normal path | After the primary processing phase completes and all changelist entries have been drained to Elasticsearch, the rename phase is triggered automatically. |
| Recovery path | If the transfer script was interrupted during a previous rename phase (leaving unprocessed rename_path entries in Elasticsearch), the next invocation skips primary processing and goes directly to the rename phase. |
No separate installation or configuration is required for the directory rename feature. It is built into OneFS 9.15 and follows the same installation, configuration, and scheduling as the existing MetadataIQ capability. If MetadataIQ is already configured and running on a pre-9.15 cluster, upgrading to 9.15 enables directory rename propagation automatically after the upgrade commit and subsequent resync.
The existing MetadataIQ CLI commands remain unchanged:
# isi metadataiq settings view

# isi metadataiq settings modify --schedule "every day every 5 minutes"

# isi metadataiq resync
When it comes to upgrading OneFS and MetadataIQ, the directory rename feature introduces a change to the ‘_id encoding’ in the main Elasticsearch index in order to eliminate the path dependency for hardlinks. This encoding change is not backward compatible with pre-9.15 indices, which means that a full resync is required after the NDU (non-disruptive upgrade) commit.
The important details:
- The resync is triggered automatically by the system after the upgrade commit when incompatible versions are detected. Administrators do not need to initiate it manually.
- During the resync, do not interact with or interrupt the MetadataIQ service. Manual intervention during this process may cause the resync to fail, potentially requiring a manual reset and restart.
- The resync duration depends on the size of the indexed dataset. Plan accordingly when scheduling the upgrade window.
In the event of an upgrade rollback, the producer and consumer services return to their pre-upgrade behavior automatically, resuming operation on the older version with the original schema.
Understanding how MetadataIQ’s services behave during each stage of a non-disruptive upgrade is helpful for planning:
It’s also worth understanding how the producer and consumer components behave through the upgrade lifecycle:
| Phase | Details |
| Pre-upgrade | Both producer and consumer run on the older version. The producer continues generating changelists as normal, and the consumer transfers data using the existing pre-upgrade schema. |
| Post-upgrade (mixed version): | The producer is disabled for the duration of the mixed-version window. The consumer adapts per node version — old schema on not-yet-upgraded nodes, updated logic on upgraded nodes — and transfers may pause or continue based on compatibility checks. |
| Post-commit | After the automatic resync completes, the producer is re-enabled and resumes generating changelists, while the consumer updates the database mapping and begins transferring under the new schema. |
| Post-rollback | If the upgrade is rolled back, both components simply return to their pre-upgrade behavior on the older version and the original schema. |
To illustrate the behavior, consider two scenarios that demonstrate how the rename phase handles common directory operations.
Scenario 1: Simple nested renames
Starting from a nested directory structure:
# mkdir -p /ifs/data/A/B/C/D/E/F/G/H
After the initial MetadataIQ cycle, all eight directories are indexed in Elasticsearch with their full paths. Now, two renames are performed:
# mv /ifs/data/A/B /ifs/data/A/Bx

# mv /ifs/data/A/Bx/C/D/E /ifs/data/A/Bx/C/D/Ex
In prior releases, the descendants of those directories would have retained their old paths in the index. Instead, in OneFS 9.15, when the next MetadataIQ cycle runs, the transfer agent detects both rename events during primary processing and records the new paths in the rename_path field. Then, in the rename phase, it processes the renames in depth-descending order:
- First, E → Ex is processed: /ifs/data/A/Bx/C/D/Ex/F, /ifs/data/A/Bx/C/D/Ex/F/G, and /ifs/data/A/Bx/C/D/Ex/F/G/H are all updated.
- Then, B → Bx is processed: all remaining descendants under the old /ifs/data/A/B prefix are updated to /ifs/data/A/Bx.
The outcome is that all child paths are correctly updated in the database, and no stale entries remain.
Scenario 2: Subtree moves within the same tree
Starting from the same structure, this time with more complex operations:
# mkdir -p /ifs/data/A/B/C/D/E/F/G/H

# mv /ifs/data/A/B/C/D/E /ifs/data/A/

# mv /ifs/data/A/E/F/G /ifs/data/A/B/C/D/

# mv /ifs/data/A/B /ifs/data/A/Bx
Here, subtree E is moved up to become a direct child of A, subtree G is moved into D, and B is renamed to Bx. After the MetadataIQ cycle, the database reflects all three operations correctly:
- E and its child F are now under /ifs/data/A/E and /ifs/data/A/E/F.
- G and its child H are now under /ifs/data/A/Bx/C/D/G and /ifs/data/A/Bx/C/D/G/H.
- B’s rename to Bx is propagated to all remaining descendants: /ifs/data/A/Bx/C, /ifs/data/A/Bx/C/D.
So, this results in no stale entries, nor a need for manual resync. The depth-descending processing order and the snapshot generation number atomicity ensure that even compound operations within the same tree are resolved correctly.
After a MetadataIQ cycle involving directory renames has completed, the following CLI utilities can be used to monitor and verify operation. This includes:
Checking the MetadataIQ services:
# isi services -a | grep -i metadataiq
Monitoring the ChangelistCreate job:
# isi job jobs list | grep -i ChangelistCreate
Confirming the MetadataIQ snapshot count (which should be <= 2 under healthy operating conditions):
# isi snapshot snapshots list | grep -i metadataiq
Additionally, to verify that rename propagation has completed successfully, the Elasticsearch index can be queried for any documents with a non-empty ‘rename_path’ field. In normal operation, the following query should return zero results after the transfer agent completes:
GET isi_metadata_index/_search

{

  "query": {

    "exists": {

      "field": "rename_path"

    }

  }

}
A non-zero result count indicates that rename processing was interrupted and will be completed on the next transfer agent invocation.


