In addition to the /usr/bin/isi_gather_info tool, OneFS also provides both a GUI and common ‘isi’ CLI version of the tool – albeit with slightly reduced functionality. This means that a OneFS log gather can be initiated either from the WebUI, or via the ‘isi diagnostics’ CLI command set with the following syntax:
# isi diagnostics gather start
The diagnostics gather status can also be queried as follows:
# isi diagnostics gather status

Gather is running.
Once the command has completed, the gather tarfile can be found under /ifs/data/Isilon_Support.
The ‘isi diagnostics’ configuration can also be viewed and modified as follows:
# isi diagnostics gather settings view

                Upload: Yes

                  ESRS: Yes

         Supportassist: Yes

           Gather Mode: full

  HTTP Insecure Upload: No

      HTTP Upload Host:

      HTTP Upload Path:

     HTTP Upload Proxy:

HTTP Upload Proxy Port: -

            Ftp Upload: Yes

       Ftp Upload Host: ftp.isilon.com

       Ftp Upload Path: /incoming

      Ftp Upload Proxy:

 Ftp Upload Proxy Port: -

       Ftp Upload User: anonymous

   Ftp Upload Ssl Cert:

   Ftp Upload Insecure: No
Configuration options for the ‘isi diagnostics gather’ CLI command include:
| Option | Description |
| –upload <boolean> | Enable gather upload. |
| –esrs <boolean> | Use ESRS for gather upload. |
| –gather-mode (incremental | full) | Type of gather: incremental, or full. |
| –http-insecure-upload <boolean> | Enable insecure HTTP upload on completed gather. |
| –http-upload-host <string> | HTTP Host to use for HTTP upload. |
| –http-upload-path <string> | Path on HTTP server to use for HTTP upload. |
| –http-upload-proxy <string> | Proxy server to use for HTTP upload. |
| –http-upload-proxy-port <integer> | Proxy server port to use for HTTP upload. |
| –clear-http-upload-proxy-port | Clear proxy server port to use for HTTP upload. |
| –ftp-upload <boolean> | Enable FTP upload on completed gather. |
| –ftp-upload-host <string> | FTP host to use for FTP upload. |
| –ftp-upload-path <string> | Path on FTP server to use for FTP upload. |
| –ftp-upload-proxy <string> | Proxy server to use for FTP upload. |
| –ftp-upload-proxy-port <integer> | Proxy server port to use for FTP upload. |
| –clear-ftp-upload-proxy-port | Clear proxy server port to use for FTP upload. |
| –ftp-upload-user <string> | FTP user to use for FTP upload. |
| –ftp-upload-ssl-cert <string> | Specifies the SSL certificate to use in FTPS connection. |
| –ftp-upload-insecure <boolean> | Whether to attempt a plain text FTP upload. |
| –ftp-upload-pass <string> | FTP user to use for FTP upload password. |
| –set-ftp-upload-pass | Specify the FTP upload password interactively. |
As mentioned above, ‘isi diagnostics gather’ does not present quite as broad an array of features as the isi_gather_info utility. This is primarily for security purposes, since ‘isi diagnostics’ does not require root privileges to run. Instead, a user account with the ‘ISI_PRIV_SYS_SUPPORT’ RBAC privilege is needed in order to run a gather from either the WebUI or ‘isi diagnostics gather’ CLI interface.
Once a gather is running, a second instance cannot be started from any other node until that instance finishes. Typically, a warning along the lines of the following will be displayed:
"It appears that another instance of gather is running on the cluster somewhere. If you would like to force gather to run anyways, use the --force-multiple-igi flag. If you believe this message is in error, you may delete the lock file here: /ifs/.ifsvar/run/gather.node."
This lock can be removed as follows:
# rm -f /ifs/.ifsvar/run/gather.node
A log gather can also be initiated from the OneFS WebUI by navigating to Cluster management > Diagnostics > Gather:
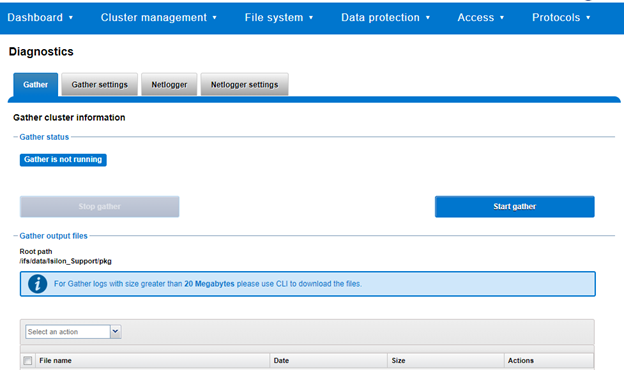
The WebUI also uses the ‘isi diagnostics’ platform API handler and so, like the CLI command, also offers a subset of the full isi_gather_info functionality.
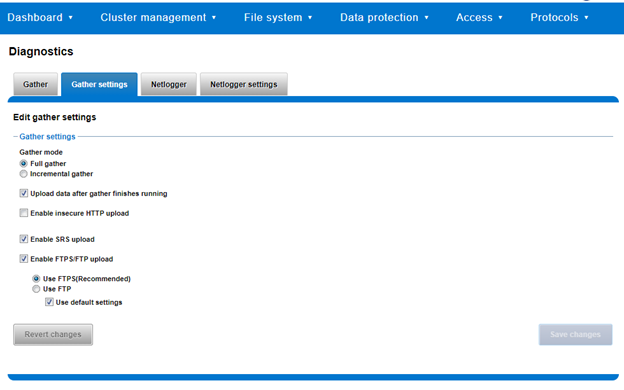
A limited menu of configuration options are also available via the WebUI under Cluster management > Diagnostics > Gather settings:
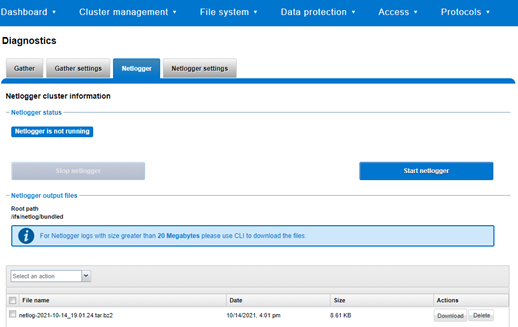
Also contained within the OneFS diagnostics command set is the ‘isi diagnostics netlogger’ utility. Netlogger captures IP traffic over a period of time for network and protocol analysis.
Under the hood, netlogger is a python wrapper around the ubiquitous tcpdump utility, and can be run either from the OneFS command line or WebUI.
For example, from the WebUI, browse to Cluster management > Diagnostics > Netlogger:
Alternatively, from the OneFS CLI, the isi_netlogger command captures traffic on interface (‘–interfaces’) over a timeout period of minutes (‘–duration’), and stores a specified number of log files ( ‘–count’).
Here’s the basic syntax of the CLI utility:
 # isi diagnostics netlogger start

        [--interfaces <str>]

        [--count <integer>]

        [--duration <duration>]

        [--snaplength <integer>]

        [--nodelist <str>]

        [--clients <str>]

        [--ports <str>]

        [--protocols (ip | ip6 | arp | tcp | udp)]

        [{--help | -h}]
Note that using the ‘-b’ bpf buffer size option will temporarily change the default buffer size while netlogger is running.
The command options include:
| Netlogger Option | Description |
| –interfaces <str> | Limit packet collection to specified network interfaces. |
| –count <integer> | The number of packet capture files to keep after they reach the duration limit. Defaults to the latest 3 files. 0 is infinite. |
| –duration <duration> | How long to run the capture before rotating the capture file. Default is 10 minutes. |
| –snaplength <integer> | The maximum amount of data for each packet that is captured. Default is 320 bytes. Valid range is 64 to 9100 bytes. |
| –nodelist <str> | List of nodes specified by LNN on which to run the capture. |
| –clients <str> | Limit packet collection to specified Client hostname / IP addresses. |
| –ports <str> | Limit packet collection to specified TCP or UDP ports. |
| –protocols (ip | ip6 | arp | tcp | udp) | Limit packet collection to specified protocols. |
Netlogger’s log files are stored by default under /ifs/netlog/<node_name>.
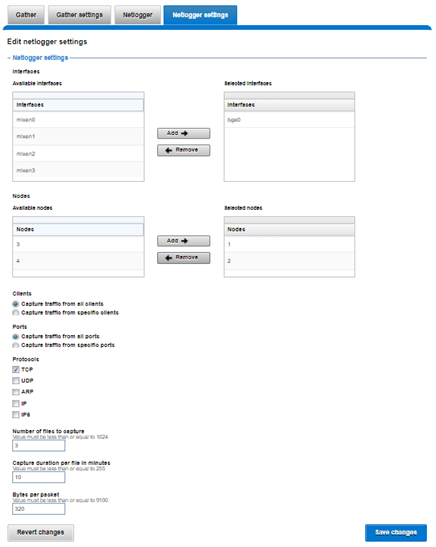
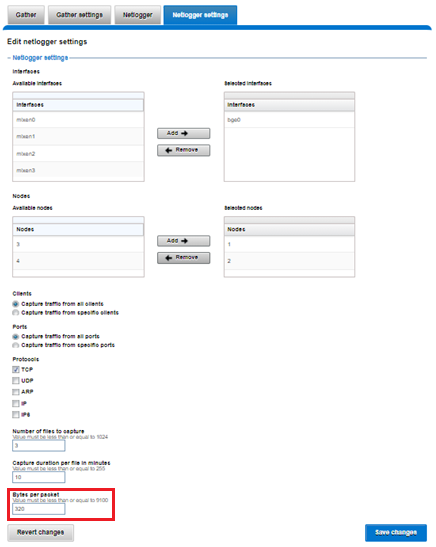
The WebUI can also be used to configure the netlogger parameters under Cluster management > Diagnostics > Netlogger settings:
Be aware that ‘isi diagnostics netlogger’ can consume significant cluster resources. When running the tool on a production cluster, be cognizant of the effect on the system.
When the command has completed, the capture file(s) are stored under:
# /ifs/netlog/[nodename]
The following command can also be used to incorporate netlogger output files into a gather_info bundle:
# isi_gather_info -n [node#] -f /ifs/netlog
To capture on multiple nodes of the cluster, the netlogger command can be prefixed by the versatile isi_for_array utility:
# isi diagnostics netlogger --nodelist 2,3 --timeout 5 --snaplength 256
The command syntax above will create five minute incremental files on nodes 2 and 3, using a snaplength of 256 bytes, which will capture the first 256 bytes of each packet. These five-minute logs will be kept for about three days and the naming convention is of the form netlog-<node_name>-<date>-<time>.pcap. For example:
# ls /ifs/netlog/tme_h700-1

netlog-tme_h700-1.2022-09-02_10.31.28.pcap
When using netlogger, the ‘–snaplength’ option needs to be set appropriately based on the protocol being to capture the right amount of detail in the packet headers and/or payload. Or, if you want the entire contents of every packet, a value of zero (‘–snaplength 0’) can be used.
The default snaplength for netlogger is to capture 320 bytes per packet, which is typically sufficient for most protocols.
However, for SMB, a snaplength of 512 is sometimes required. Note that, depending on a node’s traffic quantity, a snaplength of 0 (eg: capture whole packet) can potentially overwhelm the network interface driver.
All the output gets written to files under /ifs/netlog directory, and the default capture time is ten minutes (‘–duration 10’).
Filters can be applied to the filter to the end to constrain traffic to/from certain hosts or protocols. For example, to limit output to traffic between client 10.10.10.1:
# isi diagnostics netlogger --duration 5 --snaplength 256 --clients 10.10.10.1
Or to capture only NFS traffic, filter on port 2049:
# isi diagnostics netlogger --ports 2049