The OneFS Job Engine provides detailed monitoring and statistics gathering, with insight into jobs and Job Engine. A variety of Job Engine specific metrics are available via the OneFS CLI, including per job disk usage, etc, with CLI command ‘isi job statistics list’.
For example:
# isi job statistics list

Job ID  Phase  CPU Avg.  Virt. Mem. Avg.  Phys. Mem. Avg.  I/O Ops  I/O Bytes

----------------------------------------------------------------------------

87      1      0.52%     77.44M           37.00M           1115337  8.51G

88      1      2.35%     75.84M           36.80M           16192    125.66M

89      1      0.48%     6.01M            2.67M            0        0.00

----------------------------------------------------------------------------
In verbose mode, worker statistics and job level resource usage can also be viewed:
# isi job statistics list -v | more

Job ID: 87

 Phase: 1
 Nodes
             Node: 1
              PID: 38164
              CPU: 0.00% (0.00% min, 4.30% max, 0.40% avg)

       Virtual Mem.: 76.92M (74.38M min, 76.92M max, 76.53M avg)
      Physical Mem.: 36.33M (35.93M min, 36.33M max, 36.13M avg)

           I/O Read: 16634 ops, 129.95M
          I/O Write: 38899 ops, 303.90M
          Workers: 1 (9.00 STW avg.)

             Node: 2
              PID: 66095
              CPU: 0.68% (0.34% min, 4.98% max, 1.22% avg)

       Virtual Mem.: 77.05M (74.38M min, 77.05M max, 76.92M avg)
      Physical Mem.: 42.07M (41.39M min, 42.07M max, 41.97M avg)

           I/O Read: 16602 ops, 129.70M
          I/O Write: 39173 ops, 306.04M
          Workers: 1 (0.00 STW avg.)
…
Additionally, the status of the Job Engine workers is available via the OneFS CLI using the ‘isi job statistics view’ command. For example:
# isi job statistics view --job-id 857

Job ID: 857

Phase: 1
Nodes
  Node: 1
     PID: 26224
     CPU: 7.96% (0.00% min, 28.96% max, 4.60% avg)

 Virtual: 187.23M (187.23M min, 187.23M max, 187.23M avg)
Physical: 19.01M (18.52M min, 19.33M max, 18.96M avg)

    Read: 931043 ops, 7.099G
   Write: 1610213 ops, 12.269G
 Workers: 1 (0.00 STW avg.)
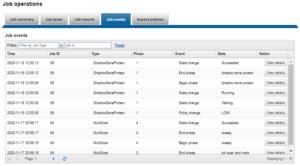
Job events, including pause/resume, waiting, phase completion, job success, failure, etc, are reported under the ‘Job Events’ tab of the WebUI. Additional information for each event is available via the “View Details” button for the appropriate job events entry in the WebUI. These are accessed by navigating to Cluster Management > Job Operations > Job Events.
A comprehensive job report is also provided for each phase of a job. This report contains detailed information on runtime, CPU, drive and memory utilization, the number of data and metadata objects scanned, and other work details or errors specific to the job type.
After a job finishes, you can view a report about the job from the CLI. You need to specify the job ID to view the report for a completed job. The isi job reports list command displays a list of all recent jobs, including job IDs. Run the isi job reports view command with a specific job ID. The following command displays the report of a Collect job with an ID of 857:
# isi job reports view 857

Collect[857] phase 1 (2020-11-14T11:39:57)

------------------------------------------

LIN scan

Elapsed time:              6506 seconds

LINs traversed:            433423

Files seen:                396980

Directories seen:          36439

Errors:                    0

Total blocks:              27357443452 (13678721726 KB)

CPU usage:                 max 28% (dev 1), min 0% (dev 1), avg 4%

Virtual memory size:       max 193300K (dev 1), min 191728K (dev 1), avg 1925

Resident memory size:      max 21304K (dev 1), min 18884K (dev 2), avg 20294K

Read:                      11637860 ops, 95272875008 bytes (90859.3M)

Write:                     20717079 ops, 169663891968 bytes (161804.1M)
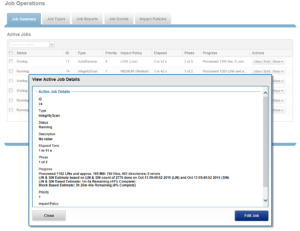
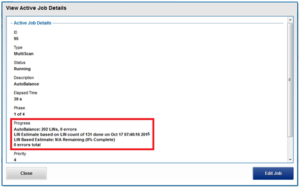
While a job is running, an Active Job Details report is also available. This provides contextual information, including elapsed time, current job phase, job progress status, etc.
For inode (LIN) based jobs, progress as an estimated percentage completion is also displayed, based on processed LIN counts.
Detailed and granular job performance information and statistics are now available in a job’s report. These new statistics include per job phase CPU and memory utilization (including minimum, minimum, and average), and total read and write IOPS and throughput.
OneFS performance resource management provides statistics for the resources used by jobs – both cluster-wide and per-node. This information is available via the isi statistics workload CLI command. Available in a ‘top’ format, this command displays the top jobs and processes, and periodically updates the information.
For example, the following syntax shows, and indefinitely refreshes, the top five processes on a cluster:
# isi statistics workload –-limit=5 -–format=top

last update:  2020-11-14T16:45:25 (s)ort: default

CPU   Reads Writes      L2    L3    Node  SystemName        JobType

1.4s  9.1k  0.0         3.5k  497.0 2     Job:  237         IntegrityScan[0]

1.2s  85.7  714.7       4.9k  0.0   1     Job:  238         Dedupe[0]

1.2s  9.5k  0.0         3.5k  48.5  1     Job:  237         IntegrityScan[0]

1.2s  7.4k  541.3       4.9k  0.0   3     Job:  238         Dedupe[0]

1.1s  7.9k  0.0         3.5k  41.6  2     Job:  237         IntegrityScan[0]
The resource statistics tracked per job, per job phase, and per node include CPU, reads, writes, and L2 & L3 cache hits. Unlike the output from the ‘top’ command, this makes it easier to diagnose individual job resource issues, etc.