OneFS Small File Storage Efficiency – Part 2

There are three main CLI commands that report on the status and effect of small file efficiency:

  • isi job reports view <job_id>
  • isi_packing –fsa
  • isi_sfse_assess

In when running the isi job report view command, enter the job ID as an argument. In the command output, the ‘file packed’ field will indicate how many files have been successfully containerized. For example, for job ID 1018:

# isi job reports view –v 1018

SmartPools[1018] phase 1 (2020-08-02T10:29:47

---------------------------------------------

Elapsed time                        12 seconds

Working time                        12 seconds

Group at phase end                  <1,6>: { 1:0-5, smb: 1, nfs: 1, hdfs: 1, swift: 1, all_enabled_protocols: 1}

Errors

‘dicom’:

      {‘Policy Number’: 0,

      ‘Files matched’: {‘head’:512, ‘snapshot’: 256}

      ‘Directories matched’: {‘head’: 20, ‘snapshot’: 10},

      ‘ADS containers matched’: {‘head’:0, ‘snapshot’: 0},

      ‘ADS streams matched’: {‘head’:0, ‘snapshot’: 0},

      ‘Access changes skipped’: 0,

‘Protection changes skipped’: 0,

‘Packing changes skipped’: 0,

‘File creation templates matched’: 0,

‘Skipped packing non-regular files’: 2,

‘Files packed’: 48672,

‘Files repacked’: 0,

‘Files unpacked’: 0,

},

}

The second command, isi_packing –fsa, provides a storage efficiency percentage in the last line of its output. This command requires InsightIQ to be licensed on the cluster and a successful run of the file system analysis (FSA) job.

If FSA has not been run previously, it can be kicked off with the following isi job jobs start FSAnalyze command. For example:

# isi job jobs start FSAnalyze

Started job [1018]

When this job has completed, run:

# isi_packing -–fsa -–fsa-jobid 1018

FSAnalyze job: 1018 (Mon Aug 2 22:01:21 2020)

Logical size:  47.371T

Physical size: 58.127T

Efficiency:    81.50%

In this case, the storage efficiency achieved after containerizing the data is 81.50%, as reported by isi_packing.

If you don’t specify an FSAnalyze job ID, the –fsa defaults to the last successful FSAnalyze job run results.

Be aware that the isi_packing –fsa command reports on the whole /ifs filesystem. This means that the overall utilization percentage can be misleading if other, non-containerized data is also present on the cluster.

There is also a Storage Efficiency assessment tool provided, which can be run as from the CLI with the following syntax:

# isi_sfse_assess <options>

Estimated storage efficiency is presented in the tool’s output in terms of raw space savings as a total and percentage and a percentage reduction in protection group overhead.

SFSE estimation summary:

* Raw space saving: 1.7 GB (25.86%)

* PG reduction: 25978 (78.73%)

When containerized files with shadow references are deleted, truncated or overwritten it can leave unreferenced blocks in shadow stores. These blocks are later freed and can result in holes which reduces the storage efficiency.

The actual efficiency loss depends on the protection level layout used by the shadow store.  Smaller protection group sizes are more susceptible, as are containerized files, since all the blocks in containers have at most one referring file and the packed sizes (file size) are small.

A shadow store deframenter helps reduce fragmentation resulting of overwrites and deletes of files. This defragmenter is integrated into the ShadowStoreDelete job. The defragmentation process works by dividing each containerized file into logical chunks (~32MB each) and assessing each chunk for fragmentation.

If the storage efficiency of a fragmented chunk is below target, that chunk is processed by evacuating the data to another location. The default target efficiency is 90% of the maximum storage efficiency available with the protection level used by the shadow store. Larger protection group sizes can tolerate a higher level of fragmentation before the storage efficiency drops below this threshold.

The ‘isi_sstore list’ command will display fragmentation and efficiency scores. For example:

# isi_sstore list -v                    

              SIN  lsize   psize   refs  filesize  date       sin type underfull frag score efficiency

4100:0001:0001:0000 128128K 192864K 32032 128128K Sep 20 22:55 container no       0.01        0.66

The fragmentation score is the ratio of holes in the data where FEC is still required, whereas the efficiency value is a ratio of logical data blocks to total physical blocks used by the shadow store. Fully sparse stripes don’t need FEC so are not included. The general rule is that lower fragmentation scores and higher efficiency scores are better.

The defragmenter does not require a license to run and is disabled by default. However, it can be easily activated using the following CLI commands:

# isi_gconfig -t defrag-config defrag_enabled=true

Once enabled, the defragmenter can be started via the job engine’s ShadowStoreDelete job, either from the OneFS WebUI or via the following CLI command:

# isi job jobs start ShadowStoreDelete

The defragmenter can also be run in an assessment mode. This reports on and helps to determine the amount of disk space that will be reclaimed, without moving any actual data. The ShadowStoreDelete job can run the defragmenter in assessment mode but the statistics generated are not reported by the job. The isi_sstore CLI command has a ‘defrag’ option and can be run with the following syntax to generate a defragmentation assessment:

# isi_sstore defrag -d -a -c -p -v

…

Processed 1 of 1 (100.00%) shadow stores, space reclaimed 31M

Summary:

    Shadows stores total: 1

    Shadows stores processed: 1

    Shadows stores skipped: 0

    Shadows stores with error: 0

    Chunks needing defrag: 4

    Estimated space savings: 31M

OneFS Small File Storage Efficiency

Archive applications such as next generation healthcare Picture Archiving and Communication Systems (PACS) are increasingly moving away from housing large archive file formats (such as tar and zip files) to storing the smaller files individually. To directly address this trend, OneFS now includes a Small File Storage Efficiency (SFSE) component. This feature maximizes the space utilization of a cluster by decreasing the amount of physical storage required to house the small files that often comprise an archive, such as a typical healthcare DICOM dataset.

Efficiency is achieved by scanning the on-disk data for small files and packing them into larger OneFS data structures, known as shadow stores. These shadow stores are then parity protected using erasure coding, and typically provide storage efficiency of 80% or greater.

OneFS Storage Efficiency for is specifically designed for infrequently modified, archive datasets. As such, it trades a small read latency performance penalty for improved storage utilization. Files obviously remain writable, since archive applications are assumed to periodically need to update at least some of the small file data.

Small File Storage Efficiency is predicated on the notion of containerization of files, and comprises six main components:

  • File pool configuration policy
  • SmartPools Job
  • Shadow Store
  • Configuration control path
  • File packing and data layout infrastructure
  • Defragmenter

The way data is laid out across the nodes and their respective disks in a cluster is fundamental to OneFS functionality. OneFS is a single file system providing one vast, scalable namespace—free from multiple volume concatenations or single points of failure. As such, a cluster can support data sets with hundreds of billions of small files all within the same file system.

OneFS lays data out across multiple nodes allowing files to benefit from the resources (spindles and cache) of up to twenty nodes. Reed-Solomon erasure coding is used to protecting at the file-level, enabling the cluster to recover data quickly and efficiently, and providing exceptional levels storage utilization. OneFS provides protection against up to four simultaneous component failures respectively. A single failure can be as little as an individual disk or an entire node.

A variety of mirroring options are also available, and OneFS typically uses these to protect metadata and small files. Striped, distributed metadata coupled with continuous auto-balancing affords OneFS near linear performance characteristics, regardless of the capacity utilization of the system. Both metadata and file data are spread across the entire cluster keeping the cluster balanced at all times.

The OneFS file system employs a native block size of 8KB, and sixteen of these blocks are combined to create a 128KB stripe unit. Files larger than 128K are protected with error-correcting code parity blocks (FEC) and striped across nodes. This allows files to use the combined resources of up to twenty nodes, based on per-file policies.

Files smaller than 128KB are unable to fill a stripe unit, so are mirrored rather than FEC protected, resulting in a less efficient on-disk footprint. For most data sets, this is rarely an issue, since the presence of a smaller number of larger FEC protected files offsets the mirroring of the small files.

For example, if a file is 24KB in size, it will occupy three 8KB blocks. If it has two mirrors for protection, there will be a total of nine 8KB blocks, or 72KB, that will be needed to protect and store it on disk. Clearly, being able to pack several of these small files into a larger, striped and parity protected container will provide a great space benefit.

Additionally, files in the 150KB to 300KB range typically see utilization of around 50%, as compared to 80% or better when containerized with the OneFS Small File Storage Efficiency feature.

Under the hood, the OneFS small file packing has similarities to the OneFS file cloning process, and both operations utilize the same underlying infrastructure – the shadow store.

Shadow stores are similar to regular files, but don’t contain all the metadata typically associated with regular file inodes. In particular, time-based attributes (creation time, modification time, etc.) are explicitly not maintained. The shadow stores for storage efficiency differ from existing shadow stores in a few ways in order to isolate fragmentation, to support tiering, and to support future optimizations which will be specific to single-reference stores.

Containerization is managed by the SmartPools job. This job typically runs by default on a cluster with a 10pm nightly schedule and a low impact management setting but can also be run manually on-demand. Additionally, the SmartPoolsTree job, isi filepool apply, and the isi set command are also able to perform file packing.

File attributes indicate each file’s pack state:

packing_policy: container or native. This indicates whether the file meets the criteria set by your file pool policies and is eligible for packing. Container indicates that the file is eligible to be packed; native indicates that the file is not eligible to be packed. Your file pool policies determine this value. The value is updated by the SmartPools job.

packing_target: container or native. This is how the system evaluates a file’s eligibility for packing based on additional criteria such as file size, type, and age. Container indicates that the file should reside in a container shadow store. Native indicates that the file should not be containerized.

packing_complete: complete or incomplete. This field establishes whether or not the target is satisfied. Complete indicates that the target is satisfied, and the file is packed. Incomplete indicates that the target is not satisfied, and the packing operation is not finished.

It’s worth noting that several healthcare archive applications can natively perform file containerization. In these cases, the benefits of OneFS small file efficiency will be negated.

Before configuring small file storage efficiency on a cluster, make sure that the following pre-requisites are met:

  1. Only enable on an archive workflow: This is strictly an archive solution. An active dataset, particularly one involving overwrites and deletes of containerized files, can generate fragmentation which impacts performance and storage efficiency.
  2. The majority of the archived data comprises small files. By default, the threshold target file size is from 0-1 MB.
  3. SmartPools software is licensed and active on the cluster.

Additionally, it’s highly recommended to have InsightIQ software licensed on the cluster. This enables the file systems analysis (FSAnalyze) job to be run, which provides enhanced storage efficiency reporting statistics.

The first step in configuring small file storage efficiency on a cluster is to enable the packing process. To do so, run the following command from the OneFS CLI:

# isi_packing –-enabled=true

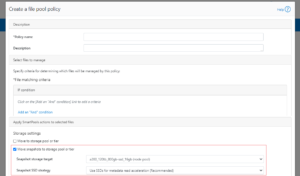
Once the isi_packing variable is set, and the licensing agreement is confirmed, configuration is done via a filepool policy. The following CLI example will containerize data under the cluster directory /ifs/data/dicom.

# isi filepool policies create dicom --enable-packing=true --begin-filter --path=/ifs/data/pacs --end-filter

The SmartPools configuration for the resulting ‘dicom’ filepool can be verified with the following command:

# isi filepool policies view dicom

                              Name: dicom

                       Description: -

                             State: OK

                     State Details:

                       Apply Order: 1

             File Matching Pattern: Birth Time > 1D AND Path == dicom (begins with)

          Set Requested Protection: -

               Data Access Pattern: -

                  Enable Coalescer: -

                    Enable Packing: Yes

...

Note:  There is no dedicated WebUI for OneFS small file storage efficiency, so configuration is performed via the CLI.

The isi_packing command will also confirm that packing has been enabled:

# isi_packing –-ls

Enabled:                            Yes

Enable ADS:                         No

Enable snapshots:                   No

Enable mirror containers:           No

Enable mirror translation:          No

Unpack recently modified:           No

Unpack snapshots:                   No

Avoid deduped files:                Yes

Maximum file size:                  1016.0k

SIN cache cutoff size:              8.00M

Minimum age before packing:        0s

Directory hint maximum entries:     16

Container minimum size:             1016.0k

Container maximum size:             1.000G

While the defaults will work for most use cases, the two values you may wish to adjust are maximum file size (–max-size <bytes>) and minimum age for packing (–min-age <seconds>).

Files are then containerized in the background via the SmartPools job, which can be run on-demand, or via the nightly schedule.

# isi job jobs start SmartPools

Started job [1016]

After enabling a new filepool policy, the SmartPools job may take a relatively long time due to packing work. However, subsequent job runs should be significantly faster.

Small file storage efficiency reporting can be viewed via the SmartPools job reports, which detail the number of files packed. For example:

#  isi job reports view –v 1016

For clusters with a valid InsightIQ license, if the FSA (file system analytics) job has run, a limited efficiency report will be available. This can be viewed via the following command:

# isi_packing -–fsa

For clusters using CloudPools software, you cannot containerize stubbed files. SyncIQ data will be unpacked, so packing will need to be configured on the target cluster.

To unpack previously packed, or containerized, files, in this case from the ‘dicom’ filepool policy, run the following command from the OneFS CLI:


# isi filepool policies modify dicom -–enable-packing=false


Before performing any unpacking, ensure there’s sufficient free space on the cluster. Also, be aware that any data in a snapshot won’t be packed – only HEAD file data will be containerized.

A threshold is provided, which prevents very recently modified files from being containerized. The default value for this is 24 hours, but this can be reconfigured via the isi_packing –min-age <seconds> command, if desired. This threshold guards against accidental misconfiguration within a filepool policy, which could potentially lead to containerization of files which are actively being modified, which could result in container fragmentation.

OneFS Automatic Replacement Recognition

Received a couple of recent questions from the field around the what’s and why’s of OneFS automatic replacement recognition and thought it would make a useful blog article topic.

OneFS Automatic Replacement Recognition (ARR) helps simplify node drive replacements and management by integrating drive discovery and formatting into a single, seamless workflow.

When a node in a cluster experiences a drive failure, it needs to be replaced by either the customer or a field service tech. Automatic replacement recognition (ARR) helps streamline this process, which previously required requires significantly more than simply physically replace the failed drive, necessitating access to the cluster’s serial console, CLI, or WebUI.

ARR simplifies the drive replacement process so that, for many of the common drive failure scenarios, the user no longer needs to manually issue a series of commands to bring the drive into use by the filesystem. Instead, ARR keeps the expander port (PHY) on so the SAS controller can easily discover whether a new drive has been inserted into a particular bay.

As we will see, OneFS has an enhanced range of cluster (CELOG) events and alerts, plus a drive fault LED sequence to guide the replacement process

Note: Automated drive replacement is limited to data drives. Boot drives, including those in bootflash chassis (IMDD) and accelerator nodes, are not supported.

ARR is enabled by default for PowerScale and Isilon Gen 6 nodes. Additionally, it also covers several previous generation nodes, including S210, X210, NL410, and HD400.

With the exception of a PHY storm, for example, expander ports are left enabled for most common drive failure scenarios to allow the SAS controller to discover new drive upon insertion. However, other drive failure scenarios may be more serious, such as the ones due to hardware failures. Certain types of hardware failures will require the cluster administrator to explicitly override the default system behavior to enable the PHY for drive replacement.

ARR also identifies and screens the various types of replacement drive. For example, some replacement drives may have come from another cluster or from a different node within the same cluster. These previously used drives cannot be automatically brought into use by the filesystem without the potential risk of losing existing data. Other replacement drives may have been previously failed and so not qualify for automatic drive re-format and filesystem join.

At its core, ARR supports automatic discovery of a new drives to simplify and automate drive replacement wherever it makes sense to do so. In order for the OneFS drive daemon, drive_d, to act autonomously with minimal user intervention, it must:

  • Enhance expander port management to leave PHY enabled (where the severity of the error is considered non-critical).
  • Filter the drive replacement type to guard against potential data loss due to drive format.
  • Log events and fire alerts, especially when the system encounters an error.

ARR automatically detects the replacement drive’s state in order to take the appropriate action. These actions include:

Part of automating the drive replacement process is to qualify drives that can be readily formatted and added to the filesystem. The detection of a drive insertion is driven by the “bay change” event where the bay transitions from having no drive or having some drive to having a different drive.

During a node’s initialization boot, newfs_efs is run initially to ‘preformat’ all the data drives. Next, mount identifies these preformatted drives and assigns each of them a drive GUID and a logical drive number (LNUM). The mount daemon then formats each drive and writes its GUID and LNUM pairing to the drive config, (drives.xml).

ARR is enabled by default but can be easily disabled if desired. To configure this from the WebUI, navigate to Cluster Management -> Automatic Replacement Recognition and select ‘Disable ARR’.

This ARR parameter can also be viewed or modified via the “isi devices config” CLI command:

# isi devices config view --node-lnn all | egrep "Lnn|Automatic Replacement Recognition" -A1 | egrep -v "Stall|--" | more

Lnn: 1

    Instant Secure Erase:

    Automatic Replacement Recognition:

        Enabled : True

Lnn: 2

    Instant Secure Erase:

    Automatic Replacement Recognition:

        Enabled : True

Lnn: 3

    Instant Secure Erase:

    Automatic Replacement Recognition:

        Enabled : True

Lnn: 4

    Instant Secure Erase:

    Automatic Replacement Recognition:

        Enabled : True

For an ARR enabled cluster, the CLI command ‘isi devices drive add <bay>’ both formats and brings the new drive into use by the filesystem.

This is in contrast to previous releases, where the cluster administrator had to issue a series of CLI or WebUI commands to achieve this (e.g. ‘isi devices drive add <bay> and ‘isi devices drive format <bay>’.

ARR is also configurable via the corresponding platformAPI URLs:

  • GET “platform/5/cluster/nodes”
  • GET/PUT “platform/5/cluster/nodes/<lnn>”
  • GET/PUT “platform/5/cluster/nodes/<lnn>/driveconfig”

Alerts are a mechanism for the cluster to notify the user of critical events. It is essential to provide clear guidance to the user on how to proceed with drive replacement under these different scenarios. Several new alerts warn the user about potential problems with the replacement drive where the resolution requires manual intervention beyond simply replacing the drive.

The following CELOG events are generated for drive state alerts:

For the SYS_DISK_SMARTFAIL and SYS_DISK_PHY_ENABLED scenarios, the alert will only be issued if ARR is enabled. More specifically, the SYS_DISK_SMARTFAIL scenario arises when an ARR-initiated filesystem join takes place. This alert will not be triggered by a user-driven process, such as when the user runs a stopfail CLI command. For the SYS_DISK_PHY_DISABLED scenario, the alert will be generated every time a drive failure occurs in a way that would render the phy disabled, regardless of ARR status.

As mentioned previously, ARR can be switched on or off anytime. Disabling ARR involves replacing the SYS_DISK_PHY_ENABLED alert with a SYS_DISK_PHY_DISABLED one.

For information and troubleshooting purposes, in addition to events and alerts, there is also an isi_drive_d.log and isi_drive_history.log under /var/log on each node.

For example, these log messages indicate that drive da10 is being smartfailed:

isi_drive_d.log:2020-07-20T17:23:02-04:00 <3.3> h500-1 isi_drive_d[18656]: Smartfailing drive da10: RPC request @ Mon Jul  3 17:23:02 2020

isi_drive_history.log:2020-07-21T17:23:02-04:00 <16.5> h500-1 isi_drive_d[18656]: smartfail RPC request bay:5 unit:10 dev:da10 Lnum:6 seq:6 model:'ST8000NM0045-1RL112' FW:UG05 SN:ZA11DEMC WWN:5000c5009129d2ff blocks:1953506646 GUID:794902d73fb958a9593560bc0007a21b usr:ACTIVE present:1 drv:OK sf:0 purpose:STORAGE

The command ‘isi devices drive view’ confirms the details and smartfail status of this drive:

h500-1# isi devices drive view B2

                  Lnn: 1

             Location: Bay  A2

                 Lnum: 6

               Device: /dev/da10

               Baynum: 5

               Handle: 348

               Serial: ZA11DEMC

                Model: ST2000NM0045-1RL112

                 Tech: SATA

                Media: HDD

               Blocks: 1953506646

 Logical Block Length: 4096

Physical Block Length: 4096

                  WWN: 5000C5009129D2FF

                State: SMARTFAIL

              Purpose: STORAGE

  Purpose Description: A drive used for normal data storage operation

              Present: Yes

    Percent Formatted: 100

Similarly, the following log message indicates that ARR is enabled and the drive da10 is being automatically added:

isi_drive_d.log:2020-07-20T17:16:57-04:00 <3.6> h500-1 isi_drive_d[4638]: /b/mnt/src/isilon/bin/isi_drive_d/drive_state.c:drive_event_start_add:248: Proceeding to add drive da10: bay=A2, in_purpose=STORAGE, dd_phase=1, conf.arr.enabled=1

There are two general situations where a failed drive is encountered:

  1. A drive fails due to hardware failure
  2. A previously failed drive is re-inserted into the bay as a replacement drive.

For both of these situations, an alert message is generated.

For self-encrypting drives (SEDs), extra steps are required to check replacement drives, but the general procedure applies to regular storage drives as well. For every drive that has ever been successfully formatted and assigned a LNUM, store its serial number (SN) and worldwide name (WWN) along with its LNUM and bay number in an XML file (i.e. ‘isi drive history.xml’).

Each entry is time-stamped to allow chronological search, in case there are multiple entries with the same SN and WWN, but different LNUM or bay number. The primary key to these entries is LNUM, with the maximum number of entries being 250 (the current OneFS logical drive number limit.

When a replacement drive is being presented for formatting, drive_d checks the drive’s SN and WWN against the history and look for the most recent entry. If a match is found, drive_d should do a reverse look up on drives.xml based on the entry’s LNUM to check the last known drive state. If the last known drive state is ok, the replacement drive can be automatically formatted and joined to the filesystem. Otherwise, the user will be alerted to take manual, corrective action.

A previously used drive is one that has an unknown drive GUID in the superblock of the drive’s data partition. In particular, an unknown drive GUID is one that does not match either the preformat GUID or one of the drive GUIDs listed in /etc/ifs/drives.xml. The drives.xml file contains a record of all the drives that are local to the node and can be used to ascertain whether a replacement drive has been previously used by the node.

A used drive can come from one of two origins:

  1. From a different node within the same cluster or
  2. From a different cluster.

To distinguish between these two origins, the cluster GUID from the drive’s superblock is compared against the cluster GUID from /etc/ifs/array.xml order to distinguish between the two cases above. If a match is found, a used drive from the same cluster will be identified by a WRONG_NODE user state. Otherwise, a used drive from a foreign cluster will be tagged with the USED user state. If for some reason, array.xml is not available, the user state of the used drive of an unknown origin will default to USED.

The amber disk failure LEDs on a node’s drive bays (and on each of a Gen6 node’s five drive sleds) indicate when, and in which bay, it is safe to replace the failed drive. The behavior of the failure LEDs for the drive replacement is as such:

  1. drive_d enables the failure LED when restripe completes.
  2. drive_d clears the failure LED upon insertion of a replacement drive into the bay.
  3. If ARR is enabled:
    1. The failure LED is lit if drive_d detects an unusable drive during the drive discovery phase but before auto format starts. Unusable drives include WRONG_NODE drives, used drives, previously failed drives, and drives of the wrong type.
    2. The failure LED is also lit if drive_d encounters any format error.
    3. The failure LED stays off if nothing goes wrong.
  4. If ARR is disabled: the failure LED will remain off until the user chooses to manually format the drive.

OneFS Multi-factor Authentication

OneFS includes a number of security features to reduce risk and provide tighter access control. Among them is support for Multi-factor Authentication, or MFA. At its essence, MFA works by verifying the identity of all users with additional mechanisms, or factors – such as phone, USB device, fingerprint, retina scan, etc – before granting access to enterprise applications and systems. This helps corporations to protect against phishing and other access-related threats.

The SSH protocol in OneFS incorporates native support for the external Cisco Duo service for unified access and security to improve trust in the users and the storage resources accessed. The SSH protocol is configured using the CLI and now can be used to store public keys in LDAP rather than stored in the user’s home directory. A key advantage to this architecture is the simplicity in setup and configuration which reduces the chance of misconfiguration. The Duo service that provides MFA access can be used in conjunction with password and/or keys to provide additional security. The Duo service delivers maximum flexibility by including support for the Duo App, SMS, voice and USB keys. As a failback, specific users and groups in an exclusion list may be allowed to bypass MFA, if specified on the Duo server. It is also possible to generate one-time access to users to accommodate events like a forgotten phone or failback mode associated with the unavailability of the Duo service.

OneFS’ SSH protocol implementation:

  • Supports Multi-Factor Authentication (MFA) with the Duo Service in conjunction with passwords and/or keys
  • Is configurable via the OneFS CLI (No WebUI support yet)
  • Can now use Public Keys stored in LDAP

Multi-factor Authentication helps to increase the security of their clusters and is a recommended best-practice for many public and private sector industry bodies, such as the MPAA.

OneFS 8.2 and later supports MFA with Duo, CLI configuration of SSH and support for storing public SSH keys in LDAP. A consistent configuration experience, heightened security and tighter access control for SSH is a priority for many customers.

The OneFS SSH authentication process is as follows:

Step Action
1 Administrator configures User Authentication Method. If configuring ‘publickey’, the correct settings are set for both SSH and PAM.
2 If User Authentication Method is ‘publickey’ or ‘both’, user’s Private Key is provided at start of session. This is verified first against the Public Key from either their home directory on the cluster the LDAP Server.
3 If Duo is enabled, the user’s name is sent to the Duo Service.

·         If the Duo config has Autopush set to yes, a One Time Key is sent to the user on the set device.

·         If the Duo config has Autopush set to no, the user chooses from a list of devices linked to their account and a One Time Key is sent to the user on that device.

·         The user enters the key at the prompt, and the key is sent to Duo for verification.

4 If User Authentication Method is ‘password’ or ‘both’, the SSH server requests the user’s password, which is sent to PAM and verified against the password file or LSASS.
5 The user is checked for the appropriate RBAC SSH privilege
6 If all of the above steps succeed, the user is SSH granted access.


A new CLI command family is added to view and configure SSH, and defined authentication types help to eliminate misconfiguration issues. Any SSH config settings that are not exposed by the CLI can still be configured in the SSHD configuration template. In addition, Public Keys stored in LDAP may now also be used by SSH for authentication. There is no WebUI interface for SSH yet, but this will be added in a future release.

Many of the common SSH settings can now be configured and displayed via the OneFS CLI using ‘isi ssh settings modify’ and ‘isi ssh settings view’ commands respectively.

The authentication method is configured with the option ‘–user-auth-method’, which can be set to ‘password’, ‘publickey’, ‘both’ or ‘any’.  For example:

# isi ssh settings modify -–login-grace-time=1m -–permit-root-login=no –-user-auth-method=both

# isi ssh settings view

Banner:

Ciphers: aes128-ctr,aes192-ctr,aes256-ctr,aes128-gcm@openssh.com,aes256-gcm@openssh.com,chacha20-poly1305@openssh.com

Host Key Algorithms: +ssh-dss,ssh-dss-cert-v01@openssh.com

Ignore Rhosts: Yes

Kex Algorithms: curve25519-sha256@libssh.org,ecdh-sha2-nistp256,ecdh-sha2-nistp384,ecdh-sha2-nistp521,diffie-hellman-group-exchange-sha256,diffie-hellman-group-exchange-sha1,diffie-hellman-group14-sha1

Login Grace Time: 1m

Log Level: INFO

Macs: hmac-sha1

Max Auth Tries: 6

Max Sessions: –

Max Startups:

Permit Empty Passwords: No

Permit Root Login: No

Port: 22

Print Motd: Yes

Pubkey Accepted Key Types: +ssh-dss,ssh-dss-cert-v01@openssh.com

Strict Modes: No

Subsystem: sftp /usr/local/libexec/sftp-server

Syslog Facility: AUTH

Tcp Keep Alive: No

Auth Settings Template: both


On upgrade to 8.2 or later, the cluster’s existing SSH Config will automatically be imported into gconfig. This includes settings both exposed and not exposed by the CLI. Any additional SSH settings that are not included in the CLI config options can still be manually set by adding them the /etc/mcp/templates/sshd.conf file. These settings will be automatically propagated to the /etc/ssh/sshd_config file by mcp and imported into gconfig.

To aid with auditing or troubleshooting SSH, the desired verbosity of logging can be configured with the option ‘–log-level’, which accepts the default values allowed by SSH.

The ‘–match’ option allows for one or more match settings block to be set, for example:

# isi ssh settings modify –-match=”Match group sftponly

dquote>      X11Forwarding no

dquote>      AllowTcpForwarding no

dquote>      ChrootDirectory %h”


And to verify:

# less /etc/ssh/sshd_config

# X: —————-

# X: This file automatically generated. To change common settings, use ‘isi ssh’.

# X: To change settings not covered by ‘isi ssh’, please contact customer support.

# X: —————-

AuthorizedKeysCommand /usr/libexec/isilon/isi_public_key_lookup

AuthorizedKeysCommandUser nobody

Ciphers aes128-ctr,aes192-ctr,aes256-ctr,aes128-gcm@openssh.com,aes256-gcm@openssh.# X: —————-

# X: This file automatically generated. To change common settings, use ‘isi ssh’.

# X: To change settings not covered by ‘isi ssh’, please contact customer support.

# X: —————-

AuthorizedKeysCommand /usr/libexec/isilon/isi_public_key_lookup

AuthorizedKeysCommandUser nobody

Ciphers aes128-ctr,aes192-ctr,aes256-ctr,aes128-gcm@openssh.com,aes256-gcm@openssh.

com,chacha20-poly1305@openssh.com

HostKeyAlgorithms +ssh-dss,ssh-dss-cert-v01@openssh.com

IgnoreRhosts yes

KexAlgorithms curve25519-sha256@libssh.org,ecdh-sha2-nistp256,ecdh-sha2-nistp384,ecdh-sha2-nistp521,diffie-hellman-group-exchange-sha256,diffie-hellman-group-exchange-sha1,diffie-hellman-group14-sha1

LogLevel INFO

LoginGraceTime 120

MACs hmac-sha1

MaxAuthTries 6

MaxStartups 10:30:60

PasswordAuthentication yes

PermitEmptyPasswords no

PermitRootLogin yes

Port 22

PrintMotd yes

PubkeyAcceptedKeyTypes +ssh-dss,ssh-dss-cert-v01@openssh.com

StrictModes yes

Subsystem sftp /usr/local/libexec/sftp-server

SyslogFacility AUTH

UseDNS no

X11DisplayOffset 10

X11Forwarding no

Match group spftonly

X11Forwarding no

AllowTcpForwarding no

ForceCommand internal-sftp -u 0002

ChrootDirectory %h


Note that match blocks usually span multiple lines, and the ZSH shell will allow line returns and spaces until the double quotes (“) are closed.

When making SSH configuration changes, the SSH service will be restarted, but existing sessions will not be terminated. This allows for changes to be tested before ending the configuration session. Be sure to test any changes that could affect authentication before closing the current session.

A user’s public key may be viewed by adding ‘–show-ssh-key’ flag. Multiple keys may be specified in the LDAP configuration, and the key that corresponds to the private key presented in the SSH session will be used (unless there is no match of course). However, the user will still need a home directory on the cluster or they will get an error upon log-in.

OneFS can now be configured to use Cisco’s Duo MFA with SSH. Duo MFA supports the Duo App, SMS, Voice and USB Keys.

Be aware that the use of Duo requires an account with the Duo service. Duo will provide a host, ‘ikey’ and ‘skey’ to use for configuration, and the skey should be treated as a secure credential.

From the cluster side, multi-factor auth support with Duo is configured via the ‘isi auth duo’. For example, the following syntax will enable Duo support in safe mode with autopush disabled, set the ikey, and prompt interactively to configure the skey:

# isi auth duo modify -–autopush=false -–enabled=true -–failmode=safe -–host=api.9283eefe.duosecurity.com -–ikey=DIZIQCXV9HIVMKYZ8V4S -–set-skey

Enter skey:

Confirm:


Similarly, the following command will verify the cluster’s Duo config settings:

# isi auth duo view -v

Autopush: No

Enabled: Yes

Failmode: safe

Fallback Local IP: No

Groups:

HTTP Proxy:

HTTPS Timeout: 0

Prompts: 3

Pushinfo: No

Host: api.9283eefe.duosecurity.com

Ikey: DIZIQCXV9HIVMKYZ8V4S


Duo MFA rides on top of existing password and/or public key requirements and therefore cannot be configured if the SSH authentication type is set to ‘any’. Specific users or groups may be allowed to bypass MFA if specified on the Duo server, and Duo allows for the creation of one time or date/time limited bypass keys for a specific user.

Note that a bypass key will not work if ‘autopush’ is set to ‘true’, since no prompt option will be shown to the user. Be advised that Duo uses a simple name match and is not Active Directory-aware. For example, the AD user ‘DOMAIN\foo’ and the LDAP user ‘foo’ are the considered to be one and the same user by Duo.

Duo uses HTTPS for communication with the Duo server and there is an option to set a proxy to use if needed. Duo also has a failback mode specifying what to do if the Duo service is unavailable:

Failback Mode Characteristics
Safe In safe mode SSH will allow normal authentication if Duo can not be reached.
Secure In secure mode SSH will fail if Duo can not be reached. This includes ‘bypass’ users, since the bypass state is determined by the Duo service.


The Duo ‘autopush’ option controls whether a key will be automatically pushed or if a user can choose the method:

Autopush Option Characteristics
Yes If set to yes, Duo will push the one-time key to the device associated with the user.
No If set to no, Duo will provide a list of methods to push the one-time key to.
Pushinfo The Pushinfo option allows a small message to be sent to the user along with the one-time key as part of the push notification.


Duo may be disabled and re-enabled without re-entering the host, ikey and skey.

The ‘groups’ option groups may be used to specify one or more groups to be associated with the Duo Service and can be used to create an exclusion list. Three types of groups may be configured:

Group Option Characteristics
Local Local groups using the local authentication provider.
Remote Remote authentication provider groups, such as LDAP.
Duo Duo Groups created and managed though the Duo Service.


A Duo group can be used to both add users to the group and specify that its status is ‘Bypass’. This will allow users of this group to SSH in without MFA. Configuration is within Duo itself and the users must already be known to the Duo service. The Duo service must still be contacted to determine whether the user is in the bypass group or not.

Using a local or remote authentication provider group allows users without a Duo account to be added to the group. If a user is in a group that has been added to the Isilon Duo the user can SSH into the cluster without a Duo account. The created account can then be approved by an administrator at which time the user can SSH into the cluster.

It is also possible to create a local or remote provider group as an exclusion group by configuring it via the CLI with a ‘!’ before it. Any user in this group will not be prompted for a Duo key. Note that ZSH, OneFS’ default CLI shell, typically requires the ‘!’ character to be escaped.

This exclusion is checked by OneFS prior to contacting Duo. This is one method of creating users that can SSH into the cluster even when the Duo Service is not available and failback mode is set to secure. If using such an exclusion group, it should be preceded by an asterisk to ensure that all other groups do required the Duo One Time Key. For example:

# isi auth duo modify –groups=”*,\!duo_exclude”

# isi auth duo view -v

Autopush: No

Enabled: No

Failmode: safe

Fallback Local IP: No

Groups: *,!duo_exclude

HTTP Proxy:

HTTPS Timeout: 0

Prompts: 3

Pushinfo: No

Host: api-9283eefe.duosecurity.com

Ikey: DIZIQCXV9HIVMKYZ8V4S

The ‘groups’ option can also be used to specify users that are required to use Duo while users not in the group do not need to. For example: “–groups=<group>”.

The following output shows a multi-factor authenticated SSH session to a cluster running OneFS 8.2 using a passcode:

# ssh duo_user1@isilon.com

Duo two-factor login for duo_user1


Enter a passcode or select one of the following options:


  1. Duo Push to iOS
  2. Duo Push to XXX-XXX-4237
  3. Phone call to XXX-XXX-4237
  4. SMS passcodes to XXX-XXX-4237 (next code starts with: 1)

Passcode or option (1-4): 907949100

Success. Logging you in…

Password:

Copyright (c) 2001-2017 EMC Corporation. All Rights Reserved.

Copyright (c) 1992-2017 The FreeBSD Project.

Copyright (c) 1979, 1980. 1983, 1986, 1989, 1991, 1992, 1993, 1994

The Regents of the University of California. All rights reserved.

With 8.2 and later, Public SSH keys can eb used from LDAP rather than from a user’s home directory on the cluster. For example:

# isi auth users view –-user=ssh_user_1 –-show-ssh-keys

Name: ssh_user1_rsa

DN: cn-ssh_user1_rsa,ou=People,dc=tme-ldap1dc=isilon,dc=com

DNS Domain: –

Domain: LDAP_USERS

Provider: lsa-ldap-provider:tme-ldap1

Sam Account Name: ssh_user1_rsa

UID: 4567

SID: S-1-22-1-4567

Enabled: Yes

Expired: No

Expiry: –

Locked: No

Email: –

GECOS: The private SSH key for this user may be found at isilon/tst/ssh_tst_keys. The key type will match the end of the user name (rsa in this case)

Generated GID: No

Generated UID: No

Generated UPN: –

Primary Group

ID: GID:4567

Name: ssh_user1_rsa

Home Directory: /ifs/home/ssh_user1_rsa

Max Password Age: –

Password Expired: No

Password Expiry: –

Password Last Set: –

Password Expires: Yes

Shell: /usr/local/bin/zsh

UPN: –

User Can Change Password: No

SSH Public Keys: ssh-rsa AAAAB3Nza……………


The LDAP create and modify commands also now include the ‘–ssh-public-key-attribute’ option. The most common attribute for this is the sshPublicKey attribute from the ldapPublicKey objectClass.

OneFS GMP Scalability with Isi_Array_d

OneFS currently supports a maximum cluster size of 252 nodes, up from 144 nodes in releases prior to OneFS 8.2. To support this increase in scale, GMP transaction latency was dramatically improved by eliminating serialization and reducing its reliance on exclusive merge locks.

Instead, GMP now employs a shared merge locking model.

Take the four node cluster above. In this serialized locking example, the interaction between the two operations is condensed, illustrating how each node can finish its operation independent of its peers. Note that the diamond icons represent the ‘loopback’ messaging to node 1.

Each node takes its local exclusive merge lock. By not serializing/locking, the group change impact is significantly reduced, allowing OneFS to support greater node counts. It is expensive to stop GMP messaging on all nodes to allow this. While state is not synchronized immediately, it will be the same after a short while. The caller of a service change will not return until all nodes have been updated. Once all nodes have replied, the service change has completed. It is possible that multiple nodes change a service at the same time, or that multiple services on the same node change.

The example above illustrates nodes {1,2} merging with nodes {3, 4}. The operation is serialized, and the exclusive merge lock will be taken. In the diagram, the wide arrows represent multiple messages being exchanged. The green arrows show the new service exchange. Each node sends its service state to all the nodes new to it and receives the state from all new nodes. There is no need to send the current service state to any node in a group prior to the merge.

During a node split, there are no synchronization issues because either order results in the services being down, and the existing OneFS algorithm still applies.

OneFS 8.2 also saw the introduction of a new daemon, isi_array_d, which replaces isi_boot_d from prior versions. Isi_array_d is based on the Paxos consensus protocol.

Paxos is used to manage the process of agreeing on a single, cluster-wide result amongst a group of potential transient nodes. Although no deterministic, fault-tolerant consensus protocol can guarantee progress in an asynchronous network, Paxos guarantees safety (consistency), and the conditions that could prevent it from making progress are difficult to trigger.

In 8.2 and later, a unique GMP Cookie on each node in the cluster replaces the previous cluster-wide GMP ID. For example

  • # sysctl efs.gmp.group
  • gmp.group: <889a5e> (5) :{ 1-3:0-5, smb: 1-3, nfs: 1-3, all_enabled_protocols: 1-3, isi_cbind_d: 1-3 }

The GMP Cookie is a hexadecimal number. The initial value is calculated as a function of the current time, so it remains unique even after a node is rebooted. The cookie changes whenever there is a GMP event and is unique on power-up. In this instance, the (5) represents the configuration generation number.

In the interest of ease of readability in large clusters, logging verbosity is also reduced. Take the following syslog entry, for example:

2019-05-12T15:27:40-07:00 <0.5> (id1) /boot/kernel.amd64/kernel: connects: { { 1.7.135.(65-67)=>1-3 (IP), 0.0.0.0=>1-3, 0.0.0.0=>1-3, }, cfg_gen:1=>1-3, owv:{ build_version=0x0802009000000478 overrides=[ { version=0x08020000 bitmask=0x0000ae1d7fffffff }, { version=0x09000100 bitmask=0x0000000000004151 } ] }=>1-3, }

Only the lowest node number in a group proposes a merge or split to avoid too many retries from multiple proposing nodes.

GMP will always select nodes to merge to form the biggest group and equal size groups will be weighted towards the smaller node numbers. For example:

{1, 2, 3, 5} > {1, 2, 4, 5}

Discerning readers will have likely noticed a new ‘isi_cbind_d’ entry appended to the group sysctl output above. This new GMP service shows which nodes have connectivity to the DNS servers. For instance, in the following example node 2 is not communicating with DNS.

# sysctl efs.gmp.group

efs.gmp.group: <889a65> (5) :{ 1-3:0-5, smb: 1-3, nfs: 1-3, all_enabled_protocols: 1-3, isi_cbind_d: 1,3 }

As you may recall, isi_cbind_d is the distributed DNS cache daemon in OneFS. The primary purpose of cbind is to accelerate DNS lookups on the cluster, in particular for NFS, which can involve a large number of DNS lookups, especially when netgroups are used. The design of the cache is to distribute the cache and DNS workload among each node of the cluster.

Cbind has also also re-architected to improve its operation with large clusters. The primary change has been the introduction of a consistent hash to determine the gateway node to cache a request. This consistent hashing algorithm, which decides on which node to cache an entry, has been designed to minimize the number of entry transfers as nodes are added/removed. In so doing, it has also usefully reduced the number of threads and UDP ports used.

The cache is logically divided into two parts:

Component Description
Gateway cache The entries that this node will refresh from the DNS server.
Local cache The entries that this node will refresh from the Gateway node.


To illustrate cbind consistant hashing, consider the following three node cluster:

In the scenario above, when the cbind service on Node 3 becomes active, one third each of the gateway cache from node 1 and 2 respectively gets transferred to node 3.

Similarly, if node 3’s cbind service goes down, it’s gateway cache is divided equally between nodes 1 and 2.

For a DNS request on node 3, the node first checks its local cache. If the entry is not found, it will automatically query the gateway (for example, node 2). This means that even if node 3 cannot talk to the DNS server directly, it can still cache the entries from a different node.

Cluster Composition and GMP – Part 3

In the third and final of these articles on OneFS groups, we’ll take a look at what and how we can learn about a cluster’s state and transitions. Simply put, ‘group state’ is a list of nodes, drives and protocols which are participating in a cluster at a particular point in time.

Under normal operating conditions, every node and its requisite disks are part of the current group, and the group status can be viewed from any node in the cluster using the ‘sysctl efs.gmp.group’ CLI command. If a greater level of detail is desired, the syscl efs.gmp.current_info command will report extensive current GMP information.

When a group change occurs, a cluster-wide process writes a message describing the new group membership to /var/log/messages on every node. Similarly, if a cluster ‘splits’, the newly-formed sub-clusters behave in the same way: each node records its group membership to /var/log/messages. When a cluster splits, it breaks into multiple clusters (multiple groups). This is rarely, if ever, a desirable event. A cluster is defined by its group members. Nodes or drives which lose sight of other group members no longer belong to the same group and therefor no longer belong to the same cluster.

The ‘grep’ CLI utility can be used to view group changes from one node’s perspective, by searching /var/log/messages for the expression ‘new group’. This will extract the group change statements from the logfile. The output from this command may be lengthy, so can be piped to the ‘tail’ command to limit it the desired number of lines.

Please note that, for the sake of clarity, the protocol information has been removed from the end of each group string in all the following examples. For example:

{ 1-3:0-11, smb: 1-3, nfs: 1-3, hdfs: 1-3, all_enabled_protocols: 1-3, isi_cbind_d: 1-3, lsass: 1-3, s3: 1-3 }


Will be represented as:


{ 1-3:0-11 }


In the following example, the ‘tail -10’ command limits the outputted list to the last ten group changes reported in the file:

tme-1# grep -i ‘new group’ /var/log/messages | tail –n 10

2020-06-15-T08:07:50 -04:00 <0.4> tme-1 (id1) /boot/kernel.amd64/kernel: [gmp_info.c:1863] (pid 1814=”kt: gmp-drive-updat”) new group: : { 1:0-4, down: 1:5-11, 2-3 }

2020-06-15-T08:07:50 -04:00 <0.4> tme-1 (id1) /boot/kernel.amd64/kernel: [gmp_info.c:1863] (pid 1814=”kt: gmp-drive-updat”) new group: : { 1:0-5, down: 1:6-11, 2-3 }

2020-06-15-T08:07:50 -04:00 <0.4> tme-1(id1) /boot/kernel.amd64/kernel: [gmp_info.c:1863] (pid 1814=”kt: gmp-drive-updat”) new group: : { 1:0-6, down: 1:7-11, 2-3 }

2020-06-15-T08:07:50 -04:00 <0.4> tme-1 (id1) /boot/kernel.amd64/kernel: [gmp_info.c:1863] (pid 1814=”kt: gmp-drive-updat”) new group: : { 1:0-7, down: 1:8-11, 2-3 }

2020-06-15-T08:07:50 -04:00 <0.4> tme-1 (id1) /boot/kernel.amd64/kernel: [gmp_info.c:1863] (pid 1814=”kt: gmp-drive-updat”) new group: : { 1:0-8, down: 1:9-11, 2-3 }

2020-06-15-T08:07:50 -04:00 <0.4> tme-1 (id1) /boot/kernel.amd64/kernel: [gmp_info.c:1863] (pid 1814=”kt: gmp-drive-updat”) new group: : { 1:0-9, down: 1:10-11, 2-3 }

2020-06-15-T08:07:50 -04:00 <0.4> tme-1 (id1) /boot/kernel.amd64/kernel: [gmp_info.c:1863] (pid 1814=”kt: gmp-drive-updat”) new group: : { 1:0-10, down: 1:11, 2-3 }

2020-06-15-T08:07:50 -04:00 <0.4> tme-1 (id1) /boot/kernel.amd64/kernel: [gmp_info.c:1863] (pid 1814=”kt: gmp-drive-updat”) new group: : { 1:0-11, down: 2-3 }

2020-06-15-T08:07:51 -04:00 <0.4> tme-1 (id1) /boot/kernel.amd64/kernel: [gmp_info.c:1863] (pid 1814=”kt: gmp-merge”) new group: : { 1:0-11, 3:0-7,9-12, down: 2 }

2020-06-15-T08:07:52 -04:00 <0.4> tme-1 (id1) /boot/kernel.amd64/kernel: [gmp_info.c:1863] (pid 1814=”kt: gmp-merge”) new group: : { 1-2:0-11, 3:0-7,9-12 }

All the group changes in this set happen within two seconds of each other, so it’s worth looking earlier in the logs prior to the incident being investigated.

Here are some useful data points that can be gleaned from the example above:

  1. The last line shows that the cluster’s nodes are operational belong to the group. No nodes or drives report as down or split. (At some point in the past, drive ID 8 on node 3 was replaced, but a replacement disk was subsequently added successfully.)
  2. Node 1 rebooted. In the first eight lines, each group change is adding back a drive on node 1 into the group, and nodes two and three are inaccessible. This occurs on node reboot prior to any attempt to join an active group and is indicative of healthy behavior.
  3. Nodes 3 forms a group with node 1 before node 2 does. This could suggest that node 2 rebooted while node 3 remained up.

A review of group changes from the other nodes’ logs should be able to confirm this. In this case node 3’s logs show:

tme-1# grep -i ‘new group’ /var/log/messages | tail -10

2020-06-15-T08:07:50 -04:00 <0.4> tme-3(id3) /boot/kernel.amd64/kernel: [gmp_info.c:1863] (pid 1814=”kt: gmp-drive-updat”) new group: : { 3:0-4, down: 1-2, 3:5-7,9-12 }

2020-06-15-T08:07:50 -04:00 <0.4> tme-3(id3) /boot/kernel.amd64/kernel: [gmp_info.c:1863] (pid 1814=”kt: gmp-drive-updat”)  new group: : { 3:0-5, down: 1-2, 3:6-7,9-12 }

2020-06-15-T08:07:50 -04:00 <0.4> tme-3(id3) /boot/kernel.amd64/kernel: [gmp_info.c:1863] (pid 1814=”kt: gmp-drive-updat”) new group: : { 3:0-6, down: 1-2, 3:7,9-12 }

2020-06-15-T08:07:50 -04:00 <0.4> tme-3(id3) /boot/kernel.amd64/kernel: [gmp_info.c:1863] (pid 1814=”kt: gmp-drive-updat”) new group: : { 3:0-7, down: 1-2, 3:9-12 }

2020-06-15-T08:07:50 -04:00 <0.4> tme-3(id3) /boot/kernel.amd64/kernel: [gmp_info.c:1863] (pid 1814=”kt: gmp-drive-updat”) new group: : { 3:0-7,9, down: 1-2, 3:10-12 }

2020-06-15-T08:07:50 -04:00 <0.4> tme-3(id3) /boot/kernel.amd64/kernel: [gmp_info.c:1863] (pid 1814=”kt: gmp-drive-updat”) new group: : { 3:0-7,9-10, down: 1-2, 3:11-12 }

2020-06-15-T08:07:50 -04:00 <0.4> tme-3(id3) /boot/kernel.amd64/kernel: [gmp_info.c:1863] (pid 1814=”kt: gmp-drive-updat”) new group: : { 3:0-7,9-11, down: 1-2, 3:12 }

2020-06-15-T08:07:50 -04:00 <0.4> tme-3(id3) /boot/kernel.amd64/kernel: [gmp_info.c:1863] (pid 1814=”kt: gmp-drive-updat”) new group: : { 3:0-7,9-12, down: 1-2 }

2020-06-15-T08:07:50 -04:00 <0.4> tme-3(id3) /boot/kernel.amd64/kernel: [gmp_info.c:1863] (pid 1828=”kt: gmp-merge”) new group: : { 1:0-11, 3:0-7,9-12, down: 2 }

2020-06-15-T08:07:52 -04:00 <0.4> tme-3(id3) /boot/kernel.amd64/kernel: [gmp_info.c:1863] (pid 1828=”kt: gmp-merge”) new group: : { 1-2:0-11, 3:0-7,9-12 }

Since node 3 rebooted at the same time, it’s worth checking node 2’s logs to see if it also rebooted simultaneously. In this instance, the logfiles confirm this. Given that all three nodes rebooted at once, it’s highly likely that this was a cluster-wide event, rather than a single-node issue. OneFS ‘software watchdog’ timeouts (also known as softwatch or swatchdog), for example, cause cluster-wide reboots. However, these are typically staggered rather than simultaneous reboots. The Softwatch process monitors the kernel and dumps a stack trace and/or reboots the node when the node is not responding. This helps protects the cluster from the impact of heavy CPU starvation and aids the issue detection and resolution process.

If a cluster experiences multiple, staggered group changes, it can be extremely helpful to construct a timeline of the order and duration in which nodes are up or down. This info can then be cross-referenced with panic stack traces and other system logs to help diagnose the root cause of an event.

For example, in the following log excerpt, a node cluster experiences six different node reboots over a twenty-minute period. These are the group change messages from node 14, which that stayed up the whole duration:

tme-14# grep -i ‘new group’ /var/log/messages

2020-06-10-T14:54:00 -04:00 <0.4> tme-14(id20) /boot/kernel.amd64/kernel: [gmp_info.c:1863] (pid 1060=”kt: gmp-merge”) new group: : { 1-2:0-11, 6-8, 9,13-15:0-11, 16:0,2-12, 17-18:0-11, 19-21, diskless: 6-8, 19-21 }

2020-06-15-T06:44:38 -04:00 <0.4> tme-14(id20) /boot/kernel.amd64/kernel: [gmp_info.c:1863] (pid 1060=”kt: gmp-split”) new group: : { 1-2:0-11, 6-8, 13-15:0-11, 16:0,2-12, 17- 18:0-11, 19-21, down: 9}

2020-06-15-T06:44:58 -04:00 <0.4> tme-14(id20) /boot/kernel.amd64/kernel: [gmp_info.c:1863] (pid 1066=”kt: gmp-split”) new group: : { 1:0-11, 6-8, 13-14:0-11, 16:0,2-12, 17- 18:0-11, 19-21, down: 2, 9, 15}

2020-06-15-T06:45:20 -04:00 <0.4> tme-14(id20) /boot/kernel.amd64/kernel: [gmp_info.c:1863] (pid 1066=”kt: gmp-split”) new group: : { 1:0-11, 6-8, 14:0-11, 16:0,2-12, 17-18:0- 11, 19-21, down: 2, 9, 13, 15}

2020-06-15-T06:47:09 -04:00 <0.4> tme-14(id20) /boot/kernel.amd64/kernel: [gmp_info.c:1863] (pid 1066=”kt: gmp-merge”) new group: : { 1:0-11, 6-8, 9,14:0-11, 16:0,2-12, 17- 18:0-11, 19-21, down: 2, 13, 15}

2020-06-15-T06:47:27 -04:00 <0.4> tme-14(id20) /boot/kernel.amd64/kernel: [gmp_info.c:1863] (pid 1066=”kt: gmp-split”) new group: : { 6-8, 9,14:0-11, 16:0,2-12, 17-18:0-11, 19-21, down: 1-2, 13, 15}

2020-06-15-T06:48:11 -04:00 <0.4> tme-14(id20) /boot/kernel.amd64/kernel: [gmp_info.c:1863] (pid 2102=”kt: gmp-split”) new group: : { 6-8, 9,14:0-11, 16:0,2-12, 17:0-11, 19- 21, down: 1-2, 13, 15, 18}

2020-06-15-T06:50:55 -04:00 <0.4> tme-14(id20) /boot/kernel.amd64/kernel: [gmp_info.c:1863] (pid 2102=”kt: gmp-merge”) new group: : { 6-8, 9,13-14:0-11, 16:0,2-12, 17:0-11, 19- 21, down: 1-2, 15, 18}

2020-06-15-T06:51:26 -04:00 <0.4> tme-14(id20) /boot/kernel.amd64/kernel: [gmp_info.c:1863] (pid 85396=”kt: gmp-merge”) new group: : { 2:0-11, 6-8, 9,13-14:0-11, 16:0,2-12, 17:0-11, 19-21, down: 1, 15, 18}

2020-06-15-T06:51:53 -04:00 <0.4> tme-14(id20) /boot/kernel.amd64/kernel: [gmp_info.c:1863] (pid 85396=”kt: gmp-merge”) new group: : { 2:0-11, 6-8, 9,13-15:0-11, 16:0,2-12, 17:0-11, 19-21, down: 1, 18}

2020-06-15-T06:54:06 -04:00 <0.4> tme-14(id20) /boot/kernel.amd64/kernel: [gmp_info.c:1863] (pid 85396=”kt: gmp-merge”) new group: : { 1-2:0-11, 6-8, 9,13-15:0-11, 16:0,2-12, 17:0-11, 19-21, down: 18}

2020-06-15-T06:56:10 -04:00 <0.4> tme-14(id20) /boot/kernel.amd64/kernel: [gmp_info.c:1863] (pid 2102=”kt: gmp-merge”) new group: : { 1-2:0-11, 6-8, 9,13-15:0-11, 16:0,2-12, 17-18:0-11, 19-21}

2020-06-15-T06:59:54 -04:00 <0.4> tme-14(id20) /boot/kernel.amd64/kernel: [gmp_info.c:1863] (pid 85396=”kt: gmp-split”) new group: : { 1-2:0-11, 6-8, 9,13-15,17-18:0-11, 19-21, down: 16}

2020-06-15-T07:05:23 -04:00 <0.4> tme-14(id20) /boot/kernel.amd64/kernel: [gmp_info.c:1863] (pid 1066=”kt: gmp-merge”) new group: : { 1-2:0-11, 6-8, 9,13-15:0-11, 16:0,2-12, 17-18:0-11, 19-21}

First, run the isi_nodes “%{name}: LNN %{lnn}, Array ID %{id}” to map the cluster’s node names to their respective Array IDs.

Before the cluster node outage event on June 15 there was a group change on June 10:

2020-06-10-T14:54:00 -04:00 <0.4> tme-14(id20) /boot/kernel.amd64/kernel: [gmp_info.c:1863] (pid 1060=”kt: gmp-merge”) new group: : { 1-2:0-11, 6-8, 9,13-15:0-11, 16:0,2-12, 17-18:0-11, 19-21, diskless: 6-8, 19-21 }

After that, all nodes came back online and the cluster could be considered healthy. The cluster contains nine X210s with twelve drives apiece and six diskless nodes (accelerators). The Array IDs now extend to 21, and Array IDs 3 through 5 and 10 through 12 are missing. This confirms that six nodes were added to or removed from the cluster.

So, the first event occurs at 06:44:38 on 15 June:

2020-06-15-T06:44:38 -04:00 <0.4> tme-14(id20) /boot/kernel.amd64/kernel: [gmp_info.c:1863] (pid 1060=”kt: gmp-split”) new group: : { 1-2:0-11, 6-8, 13-15:0-11, 16:0,2-12, 17- 18:0-11, 19-21, down: 9, diskless: 6-8, 19-21 }

Node 14 identifies Array ID 9 (LNN 6) as having left the group.

Next, twenty seconds later, two more nodes (2 & 15) are marked as offline:

2020-06-15-T06:44:58 -04:00 <0.4> tme-14(id20) /boot/kernel.amd64/kernel: [gmp_info.c:1863] (pid 1066=”kt: gmp-split”) new group: : { 1:0-11, 6-8, 13-14:0-11, 16:0,2-12, 17- 18:0-11, 19-21, down: 2, 9, 15, diskless: 6-8, 19-21 }

Twenty-two seconds later, another node goes offline:

2020-06-15-T06:45:20 -04:00 <0.4> tme-14(id20) /boot/kernel.amd64/kernel: [gmp_info.c:1863] (pid 1066=”kt: gmp-split”) new group: : { 1:0-11, 6-8, 14:0-11, 16:0,2-12, 17-18:0- 11, 19-21, down: 2, 9, 13, 15, diskless: 6-8, 19-21 }

At this point, four nodes (2,6,7, & 9) are marked as being offline:

Almost two minutes later, the previously down node (node 6) rejoins the group:

2020-06-15-T06:47:09 -04:00 <0.4> tme-14(id20) /boot/kernel.amd64/kernel: [gmp_info.c:1863] (pid 1066=”kt: gmp-merge”) new group: : { 1:0-11, 6-8, 9,14:0-11, 16:0,2-12, 17- 18:0-11, 19-21, down: 2, 13, 15, diskless: 6-8, 19-21 }

However, twenty-five seconds after node 6 comes back, node 1 leaves the group:

2020-06-15-T06:47:27 -04:00 <0.4> tme-14(id20) /boot/kernel.amd64/kernel: [gmp_info.c:1863] (pid 1066=”kt: gmp-split”) new group: : { 6-8, 9,14:0-11, 16:0,2-12, 17-18:0-11, 19-21, down: 1-2, 13, 15, diskless: 6-8, 19-21 }

Finally, the group returns to its original composition:

2020-06-15-T07:05:23 -04:00 <0.4> tme-14(id20) /boot/kernel.amd64/kernel: [gmp_info.c:1863] (pid 1066=”kt: gmp-merge”) new group: : { 1-2:0-11, 6-8, 9,13-15:0-11, 16:0,2-12, 17-18:0-11, 19-21, diskless: 6-8, 19-21 }

As such, a timeline of this cluster event could read:

  1. June 15 06:44:38 6 down
  2. June 15 06:44:58 2, 9 down (6 still down)
  3. June 15 06:45:20 7 down (2, 6, 9 still down)
  4. June 15 06:47:09 6 up (2, 7, 9 still down)
  5. June 15 06:47:27 1 down (2, 7, 9 still down)
  6. June 15 06:48:11 12 down (1, 2, 7, 9 still down)
  7. June 15 06:50:55 7 up (1, 2, 9, 12 still down)
  8. June 15 06:51:26 2 up (1, 9, 12 still down)
  9. June 15 06:51:53 9 up (1, 12 still down)
  10. June 15 06:54:06 1 up (12 still down)
  11. June 15 06:56:10 12 up (none down)
  12. June 15 06:59:54 10 down
  13. June 15 07:05:23 10 up (none down)

The next step would be to review the logs from the other nodes in the cluster for this time period and construct similar timeline. Once done, these can be distilled into one comprehensive, cluster-wide timeline.

Note: Before triangulating log events across a cluster, it’s important to ensure that the constituent nodes’ clocks are all synchronized. To check this, run the isi_for_array –q date command on all nodes and confirm that they match. If not, apply the time offset for a particular node to the timestamps of its logfiles.

Here’s another example of how to interpret a series of group events in a cluster. Consider the following group info excerpt from the logs on node 1 of the cluster:

2020-06-15-T18:01:17 -04:00 <0.4> tme-1(id1) /boot/kernel.amd64/kernel: [gmp_info.c:1863] (pid 5681=”kt: gmp-config”) new group: <1,270>: { 1:0-11, down: 2, 6-11, diskless: 6-8 }

2020-06-15-T18:02:05 -04:00 <0.4> tme-1(id1) /boot/kernel.amd64/kernel: [gmp_info.c:1863] (pid 5681=”kt: gmp-config”) new group: <1,271>: { 1-2:0-11, 6-8, 9-11:0-11, soft_failed: 11, diskless: 6-8 }

2020-06-15-T18:08:56 -04:00 <0.4> tme–1(id1) /boot/kernel.amd64/kernel: [gmp_info.c:1863] (pid 10899=”kt: gmp-split”) new group: <1,272>: { 1-2:0-11, 6-8, 9-10:0-11, down: 11, soft_failed: 11, diskless: 6-8 }

2020-06-15-T18:08:56 -04:00 <0.4> tme-1(id1) /boot/kernel.amd64/kernel: [gmp_info.c:1863] (pid 10899=”kt: gmp-config”) new group: <1,273>: { 1-2:0-11, 6-8, 9-10:0-11, diskless: 6-8}

2020-06-15-T18:09:49 -04:00 <0.4> tme-1(id1) /boot/kernel.amd64/kernel: [gmp_info.c:1863] (pid 10998=”kt: gmp-config”) new group: <1,274>: { 1-2:0-11, 6-8, 9-10:0-11, soft_failed: 10, diskless: 6-8 }

2020-06-15-T18:15:34 -04:00 <0.4> tme-1(id1) /boot/kernel.amd64/kernel: [gmp_info.c:1863] (pid 12863=”kt: gmp-split”) new group: <1,275>: { 1-2:0-11, 6-8, 9:0-11, down: 10, soft_failed: 10, diskless: 6-8 }

2020-06-15-T18:15:34 -04:00 <0.4> tme-1(id1) /boot/kernel.amd64/kernel: [gmp_info.c:1863] (pid 12863=”kt: gmp-config”) new group: <1,276>: { 1-2:0-11, 6-8, 9:0-11, diskless: 6-8 }

The timeline of events here can be interpreted as such:

  1. In the first line, node 1 has just rebooted: node 1 is up, and all other nodes that are part of the cluster are down. (Nodes with Array IDs 3 through 5 were removed from the cluster prior to this sequence of events.)
  2. The second line indicates that all the nodes have returned to the group, except for Array ID 11, which has been smartfailed.
  3. In the third line, Array ID 11 is both smartfailed but also offline.
  4. Moments later in the fourth line, Array ID 11 has been removed from the cluster entirely.
  5. Less than a minute later, the node with array ID 10 is smartfailed, and the same sequence of events occur.
  6. After the smartfail finishes, the cluster group shows node 10 as down, then removed entirely.

Because group changes document the cluster’s actual configuration from OneFS’ perspective, they’re a vital tool in understanding which devices the cluster considers available, and which devices the cluster considers as having failed, at a point in time. This information, when combined with other data from cluster logs, can provide a succinct but detailed cluster history, simplifying both debugging and failure analysis.

Cluster Composition and GMP – Part 2

As we saw in the first of these blog articles, in OneFS parlance a group is a list of nodes, drives and protocols which are currently participating in the cluster. Under normal operating conditions, every node and its requisite disks are part of the current group, and the group’s status can be viewed by running sysctl efs.gmp.group on any node of the cluster.

For example, on a three node cluster:

# sysctl efs.gmp.group

efs.gmp.group: <2,288>: { 1-3:0-11, smb: 1-3, nfs: 1-3, hdfs: 1-3, all_enabled_protocols: 1-3, isi_cbind_d: 1-3, lsass: 1-3, s3: 1-3’ }

So, OneFS group info comprises three main parts:

  • Sequence number: Provides identification for the group (ie.’ <2,288>’ )
  • Membership list: Describes the group (ie. ‘1-3:0-11’ )
  • Protocol list: Shows which nodes are supporting which protocol services (ie. { smb: 1-3, nfs: 1-3, hdfs: 1-3, all_enabled_protocols: 1-3, isi_cbind_d: 1-3, lsass: 1-3, s3: 1-3

Please note that, for the sake of ease of reading, the protocol information has been removed from each of the group strings in all the following examples.

If more detail is desired, the syscl efs.gmp.current_info command will report extensive current GMP information.

The membership list {1-3:0-11, … } represents our three node cluster, with nodes 1 through 3, each containing 12 drives, numbered zero through 11. The numbers before the colon in the group membership string represent the participating Array IDs, and the numbers after the colon are the Drive IDs.

Each node’s info is maintained in the /etc/ifs/array.xml file. For example, the entry for node 1 of the cluster above reads:

<device>

<port>5019</port>

<array_id>2</array_id>

<array_lnn>2</array_lnn>

<guid>0007430857d489899a57f2042f0b8b409a0c</guid>

<onefs_version>0x800005000100083</onefs_version>

<ondisk_onefs_version>0x800005000100083</ondisk_onefs_version>

<ipaddress name=”int-a”>192.168.76.77</ipaddress>

<status>ok</status>

<soft_fail>0</soft_fail>

<read_only>0x0</read_only>

<type>storage</type>

</device>

It’s worth noting that the Array IDs (or Node IDs as they’re also often known) differ from a cluster’s Logical Node Numbers (LNNs). LNNs are the numberings that occur within node names, as displayed by isi stat for example.

Fortunately, the isi_nodes command provides a useful cross-reference of both LNNs and Array IDs:

# isi_nodes “%{name}: LNN %{lnn}, Array ID %{id}”

node-1: LNN 1, Array ID 1

node-2: LNN 2, Array ID 2

node-3: LNN 3, Array ID 3

As a general rule, LNNs can be re-used within a cluster, whereas Array IDs are never recycled. In this case, node 1 was removed from the cluster and a new node was added instead:

node-1: LNN 1, Array ID 4

The LNN of node 1 remains the same, but its Array ID has changed to ‘4’. Regardless of how many nodes are replaced, Array IDs will never be re-used.

A node’s LNN, on the other hand, is based on the relative position of its primary backend IP address, within the allotted subnet range.

The numerals following the colon in the group membership string represent drive IDs that, like Array IDs, are also not recycled. If a drive is failed, the node will identify the replacement drive with the next unused number in sequence.

Unlike Array IDs though, Drive IDs (or Lnums, as they’re sometimes known) begin at 0 rather than at 1 and do not typically have a corresponding ‘logical’ drive number.

For example:

node-3# isi devices drive list

Lnn  Location  Device    Lnum  State   Serial

—————————————————–

3    Bay  1    /dev/da1  12    HEALTHY PN1234P9H6GPEX

3    Bay  2    /dev/da2  10    HEALTHY PN1234P9H6GL8X

3    Bay  3    /dev/da3  9     HEALTHY PN1234P9H676HX

3    Bay  4    /dev/da4  8     HEALTHY PN1234P9H66P4X

3    Bay  5    /dev/da5  7     HEALTHY PN1234P9H6GPRX

3    Bay  6    /dev/da6  6     HEALTHY PN1234P9H6DHPX

3    Bay  7    /dev/da7  5     HEALTHY PN1234P9H6DJAX

3    Bay  8    /dev/da8  4     HEALTHY PN1234P9H64MSX

3    Bay  9    /dev/da9  3     HEALTHY PN1234P9H66PEX

3    Bay 10    /dev/da10 2     HEALTHY PN1234P9H5VMPX

3    Bay 11    /dev/da11 1     HEALTHY PN1234P9H64LHX

3    Bay 12    /dev/da12 0     HEALTHY PN1234P9H66P2X

—————————————————–

Total: 12

Note that the drive in Bay 5 has an Lnum, or Drive ID, of 7, the number by which it will be represented in a group statement.

Drive bays and device names may refer to different drives at different points in time, and either could be considered a “logical” drive ID. While the best practice is definitely not to switch drives between bays of a node, if this does happen OneFS will correctly identify the relocated drives by Drive ID and thereby prevent data loss.

Depending on device availability, device names ‘/dev/da*’ may change when a node comes up, so cannot be relied upon to refer to the same device across reboots. However, Drive IDs and drive bay numbers do provide consistent drive identification.

Status info for the drives is kept in a node’s /etc/ifs/drives.xml file. Here’s the entry is for drive Lnum 0 on node Lnn 3, for example:

<logicaldrive number=”0″ seqno=”0″ active=”1″ soft-fail=”0″ ssd=”0″ purpose=”0″>66b60c9f1cd8ce1e57ad0ede0004f446</logicaldrive>

For efficiency and ease of reading, group messages combine the xml lists into a pair of numbers separated by dashes to make reporting more efficient and easier to read. For example  ‘ 1-3:0-11 ‘.

However, when a replacement disk (Lnum 12) is added to node 2, the list becomes:

{ 1:0-11, 2:0-1,3-12, 3:0-11 }.

Unfortunately, changes like these can make cluster groups trickier to read.

For example: { 1:0-23, 2:0-5,7-10,12-25, 3:0-23, 4:0-7,9-36, 5:0-35, 6:0-9,11-36 }

This describes a  cluster with two node pools. Nodes 1 to 3 contain 24 drives each, and nodes 4 through 6 are have 36 drives each. Nodes 1, 3, and 5 contain all their original drives, whereas node 2 has lost drives 6 and 11, and node 6 is missing drive 10.

Accelerator nodes are listed differently in group messages since they contain no disks to be part of the group. They’re listed twice, once as a node with no disks, and again explicitly as a ‘diskless’ node.

For example, nodes 11 and 12 in the following:

{ 1:0-23, 2,4:0-10,12-24, 5:0-10,12-16,18-25, 6:0-17,19-24, 7:0-10,12-24, 9-10:0-23, 11-12, diskless: 11-12 …}

Nodes in the process of SmartFailing are also listed both separately and in the regular group. For example, node 2 in the following:

{ 1-3:0-23, soft_failed: 2 …}

However, when the FlexProtect completes, the node will be removed from the group.

A SmartFailed node that’s also unavailable will be noted as both down and soft_failed. For example:

{ 1-3:0-23, 5:0-17,19-24, down: 4, soft_failed: 4 …}

Similarly, when a node is offline, the other nodes in the cluster will show that node as down:

{ 1-2:0-23, 4:0-23,down: 3 …}

Note that no disks for that node are listed, and that it doesn’t show up in the group.

If the node is split from the cluster—that is, if it is online but not able to contact other nodes on its back-end network—that node will see the rest of the cluster as down. Its group might look something like {6:0-11, down: 3-5,8-9,12 …} instead.

When calculating whether a cluster is below protection level, SmartFailed devices should be considered ‘in the group’ unless they are also down: a cluster with +2:1 protection with three nodes up but smartfailed does not pose an exceptional risk to data availability.

Like nodes, drives may be smartfailed and down, or smartfailed but available. The group statement looks similar to that for a smartfailed or down node, only the drive Lnum is also included. For example:

{ 1-4:0-23, 5:0-6,8-23, 6:0-17,19-24, down: 5:7, soft_failed: 5:7 }

indicates that node id 5 drive Lnum 7 is both SmartFailed and unavailable.

If the drive was SmartFailed but still available, the group would read:

{ 1-4:0-23, 5:0-6,8-23, 6:0-17,19-24, soft_failed: 5:7 }

When multiple devices are down, consolidated group statements can be tricky to read. For example, if node 1 was down, and drive 4 of node 3 was down, the group statement would read:

{ 2:0-11, 3:0-3,5-11, 4-5:0-11, down: 1, 3:4, soft_failed: 1, 3:4 }

As mentioned in the previous GMP blog article, OneFS has a read-only mode. Nodes in a read-only state are clearly marked as such in the group:

{ 1-6:0-8, soft_failed: 2, read_only: 3 }

Node 3 is listed both as a regular group member and called out separately at the end, because it’s still active. It’s worth noting that “read-only” indicates that OneFS will not write to the disks in that node. However, incoming connections to that node are still able write to other nodes in the cluster.

Non-responsive, or dead, nodes appear in groups when a node has been permanently removed from the cluster without SmartFailing the node. For example, node 11 in the following:

{ 1-5:0-11, 6:0-7,9-12, 7-10,12-14:0-11, 15:0-10,12, 16-17:0-11, dead: 11 }

Drives in a dead state include a drive number as well as a node number. For example:

{ 1:0-11, 2:0-9,11, 3:0-11, 4:0-11, 5:0-11, 6:0-11, dead: 2:10 }

In the event of a dead disk or node, the recommended course of action is to immediately start a FlexProtect and contact Isilon Support.

SmartFailed disks appear in a similar manner to other drive-specific states, and therefore include both an array ID and a drive ID. For example:

{ 1:0-11, 2:0-3,5-12, 3-4:0-11, 5:0-1,3-11, 6:0-11, soft_failed: 5:2 }

This shows drive 2 in node 5 to be SmartFailed, but still available. If the drive was physically unavailable or down, the group would show as:

{ 1:0-11, 2:0-3,5-12, 3-4:0-11, 5:0-1,3-11, 6:0-11, down: 5:2, soft_failed: 5:2 }

Stalled drives (drives that don’t respond) are marked as such, for example:

{ 1:0-2,4-11, 2-4:0-11, stalled: 1:3 }

When a drive becomes un-stalled, it simply returns to the group. In this case, the new group would return to:

{ 1-4:0-11 }

A group displays the sequence number between angle brackets. For example, <3,6>: { 1-3:0-11 }, the sequence number is <3,6>.

The first number within the sequence, in this case 3, identifies the node that initiated the most recent group change

In the case of a node leaving the group, the lowest-numbered node remaining in the cluster will initiate the group change and thus appear as the first number within the angle brackets. In the case of a node joining the group, the newly-joined node will initiate the change and thus will be the listed node. If the group change involved a single drive joining or leaving the group, the node containing that drive will initiate the change and thus will be the listed node.

The second piece of the group sequence number increases sequentially. The previous group would have had a 5 in this place; the next group should have a 7.

Rarely do we need to review sequence numbers, so long as they are increasing sequentially, and so long as they are initiated by either the lowest-numbered node, a newly-added node, or a node that removed a drive. The group membership contains the information that we most frequently require.

A group change occurs when an event changes devices participating in a cluster. These may be caused by drive removals or replacements, node additions, node removals, node reboots or shutdowns, backend (internal) network events, and the transition of a node into read-only mode. For debugging purposes, group change messages can be reviewed to determine whether any devices are currently in a failure state. We will explore this further in the next GMP blog article.


When a group change occurs, a cluster-wide process writes a message describing the new group membership to /var/log/messages on every node. Similarly, if a cluster “splits,” the newly-formed clusters behave in the same way: each node records its group membership to /var/log/messages. When a cluster splits, it breaks into multiple clusters (multiple groups). This is rarely, if ever, a desirable event. Notice that cluster and group are synonymous: a cluster is defined by its group members. Group members which lose sight of other group members no longer belong to the same group and thus no longer belong to the same cluster.

To view group changes from one node’s perspective, you can grep for the expression ‘new group’ to extract the group change statements from the log. For example:

tme-1# grep -i ‘new group’ /var/log/messages | tail –n 10

Nov 8 08:07:50 (id1) /boot/kernel/kernel: [gmp_info.c:530](pid 1814=”kt: gmpdrive-upda”) new group: : { 1:0-4, down: 1:5-11, 2-3 }

Nov 8 08:07:50 (id1) /boot/kernel/kernel: [gmp_info.c:530](pid 1814=”kt: gmpdrive-upda”) new group: : { 1:0-5, down: 1:6-11, 2-3 }

Nov 8 08:07:50 (id1) /boot/kernel/kernel: [gmp_info.c:530](pid 1814=”kt: gmpdrive-upda”) new group: : { 1:0-6, down: 1:7-11, 2-3 }

Nov 8 08:07:50 (id1) /boot/kernel/kernel: [gmp_info.c:530](pid 1814=”kt: gmpdrive-upda”) new group: : { 1:0-7, down: 1:8-11, 2-3 }

Nov 8 08:07:50 (id1) /boot/kernel/kernel: [gmp_info.c:530](pid 1814=”kt: gmpdrive-upda”) new group: : { 1:0-8, down: 1:9-11, 2-3 }

Nov 8 08:07:50 (id1) /boot/kernel/kernel: [gmp_info.c:530](pid 1814=”kt: gmpdrive-upda”) new group: : { 1:0-9, down: 1:10-11, 2-3 }

Nov 8 08:07:50 (id1) /boot/kernel/kernel: [gmp_info.c:530](pid 1814=”kt: gmpdrive-upda”) new group: : { 1:0-10, down: 1:11, 2-3 }

Nov 8 08:07:50 (id1) /boot/kernel/kernel: [gmp_info.c:530](pid 1814=”kt: gmpdrive-upda”) new group: : { 1:0-11, down: 2-3 }

Nov 8 08:07:51 (id1) /boot/kernel/kernel: [gmp_info.c:530](pid 1814=”kt: gmpmerge”) new group: : { 1:0-11, 3:0-7,9-12, down: 2 }

Nov 8 08:07:52 (id1) /boot/kernel/kernel: [gmp_info.c:530](pid 1814=”kt: gmpmerge”) new group: : {

In this case, the tail -10 command has been used to limit the returned group changes to the last ten reported in the file. All of these occur within two seconds, so in the case of an actual case, we would want to go further back, to before whatever incident was under investigation.

INTERPRETING GROUP CHANGES

Even in the example above, however, we can be sure of several things:

  • Most importantly, at last report all nodes of the cluster are operational and joined into the cluster. No nodes or drives report as down or split. (At some point in the past, drive ID 8 on node 3 was replaced, but a replacement disk has been added successfully.)
  • Next most important is that node 1 rebooted: for the first eight out of ten lines, each group change is adding back a drive on node 1 into the group, and nodes two and three are inaccessible. This occurs on node reboot prior to any attempt to join an active group and is correct and healthy behavior.
  • Note also that node 3 joins in with node 1 before node 2 does. This might be coincidental, given that the two nodes join within a second of each other. On the other hand, perhaps node 2 also rebooted while node 3 remained up. A review of group changes from these other nodes could confirm either of those behaviors.

Logging onto node 3, we can see the following:

tme-1# grep -i ‘new group’ /var/log/messages | tail -10

Jul 8 08:07:50 (id3) /boot/kernel/kernel: [gmp_info.c:530](pid 1828=”kt: gmpdrive-upda”) new group: : { 3:0-4, down: 1-2, 3:5-7,9-12 }

Jul 8 08:07:50 (id3) /boot/kernel/kernel: [gmp_info.c:530](pid 1828=”kt: gmpdrive-upda”) new group: : { 3:0-5, down: 1-2, 3:6-7,9-12 }

Jul 8 08:07:50 (id3) /boot/kernel/kernel: [gmp_info.c:530](pid 1828=”kt: gmpdrive-upda”) new group: : { 3:0-6, down: 1-2, 3:7,9-12 }

Jul 8 08:07:50 (id3) /boot/kernel/kernel: [gmp_info.c:530](pid 1828=”kt: gmpdrive-upda”) new group: : { 3:0-7, down: 1-2, 3:9-12 }

Jul 8 08:07:50 (id3) /boot/kernel/kernel: [gmp_info.c:530](pid 1828=”kt: gmpdrive-upda”) new group: : { 3:0-7,9, down: 1-2, 3:10-12 }

Jul 8 08:07:50 (id3) /boot/kernel/kernel: [gmp_info.c:530](pid 1828=”kt: gmpdrive-upda”) new group: : { 3:0-7,9-10, down: 1-2, 3:11-12 }

Jul 8 08:07:50 (id3) /boot/kernel/kernel: [gmp_info.c:530](pid 1828=”kt: gmpdrive-upda”) new group: : { 3:0-7,9-11, down: 1-2, 3:12 }

Jul 8 08:07:50 (id3) /boot/kernel/kernel: [gmp_info.c:530](pid 1828=”kt: gmpdrive-upda”) new group: : { 3:0-7,9-12, down: 1-2 }

Jul 8 08:07:50 (id3) /boot/kernel/kernel: [gmp_info.c:530](pid 1828=”kt: gmpmerge”) new group: : { 1:0-11, 3:0-7,9-12, down: 2 }

Jul 8 08:07:52 (id3) /boot/kernel/kernel: [gmp_info.c:530](pid 1828=”kt: gmpmerge”) new group: : { 1-2:0-11, 3:0-7,9-12 }

In this instance, it’s apparent that node 3 rebooted at the same time. It’s worth checking node 2’s logs to see if it also rebooted at the same time.

Given that all three nodes rebooted simultaneously, it’s highly likely that this was a cluster-wide event, rather than a single-node issue – especially since watchdog timeouts that cause cluster-wide reboots typically cause staggered rather than simultaneous reboots. The Softwatch process (also known as software watchdog or swatchdog) monitors the kernel and dumps a stack trace and/or reboots the node when the node is not responding. This tool protects the cluster from the impact of heavy CPU starvation and aids issue discovery and resolution process.

Constructing a timeline

If a cluster experiences multiple, staggered group changes, it can be extremely helpful to craft a timeline of the order and duration in which nodes are up or down. This timeline illustrates with. This info can be cross-referenced with panic stack traces and other system logs to help diagnose the root cause of an event.

For example, in the following a 15-node cluster experiences six different node reboots over a twenty-minute period. These are the group change messages from node 14, which that stayed up the whole duration:

tme-14# grep ‘new group’ tme-14-messages

Jul 8 16:44:38 tme-14(id20) /boot/kernel/kernel: [gmp_info.c:510](pid 1060=”kt: gmp-split”) new group: : { 1-2:0-11, 6-8, 13-15:0-11, 16:0,2-12, 17- 18:0-11, 19-21, down: 9}

Jul 8 16:44:58 tme-14(id20) /boot/kernel/kernel: [gmp_info.c:510](pid 1066=”kt: gmp-split”) new group: : { 1:0-11, 6-8, 13-14:0-11, 16:0,2-12, 17- 18:0-11, 19-21, down: 2, 9, 15}

Jul 8 16:45:20 tme-14(id20) /boot/kernel/kernel: [gmp_info.c:510](pid 1066=”kt: gmp-split”) new group: : { 1:0-11, 6-8, 14:0-11, 16:0,2-12, 17-18:0- 11, 19-21, down: 2, 9, 13, 15} Mar 26 16:47:09 tme-14(id20) /boot/kernel/kernel: [gmp_info.c:510](pid 1066=”kt: gmp-merge”) new group: : { 1:0-11, 6-8, 9,14:0-11, 16:0,2-12, 17- 18:0-11, 19-21, down: 2, 13, 15}

Jul 8 16:47:27 tme-14(id20) /boot/kernel/kernel: [gmp_info.c:510](pid 1066=”kt: gmp-split”) new group: : { 6-8, 9,14:0-11, 16:0,2-12, 17-18:0-11, 19-21, down: 1-2, 13, 15}

Jul 8 16:48:11 tme-14(id20) /boot/kernel/kernel: [gmp_info.c:510](pid 2102=”kt: gmp-split”) new group: : { 6-8, 9,14:0-11, 16:0,2-12, 17:0-11, 19- 21, down: 1-2, 13, 15, 18}

Jul 8 16:50:55 tme-14(id20) /boot/kernel/kernel: [gmp_info.c:510](pid 2102=”kt: gmp-merge”) new group: : { 6-8, 9,13-14:0-11, 16:0,2-12, 17:0-11, 19- 21, down: 1-2, 15, 18}

Jul 8 16:51:26 tme-14(id20) /boot/kernel/kernel: [gmp_info.c:510](pid 85396=”kt: gmp-merge”) new group: : { 2:0-11, 6-8, 9,13-14:0-11, 16:0,2-12, 17:0-11, 19-21, down: 1, 15, 18}

Jul 8 16:51:53 tme-14(id20) /boot/kernel/kernel: [gmp_info.c:510](pid 85396=”kt: gmp-merge”) new group: : { 2:0-11, 6-8, 9,13-15:0-11, 16:0,2-12, 17:0-11, 19-21, down: 1, 18}

Jul 8 16:54:06 tme-14(id20) /boot/kernel/kernel: [gmp_info.c:510](pid 85396=”kt: gmp-merge”) new group: : { 1-2:0-11, 6-8, 9,13-15:0-11, 16:0,2-12, 17:0-11, 19-21, down: 18}

Jul 8 16:56:10 tme-14(id20) /boot/kernel/kernel: [gmp_info.c:510](pid 2102=”kt: gmp-merge”) new group: : { 1-2:0-11, 6-8, 9,13-15:0-11, 16:0,2-12, 17-18:0-11, 19-21}

Jul 8 16:59:54 tme-14(id20) /boot/kernel/kernel: [gmp_info.c:510](pid 85396=”kt: gmp-split”) new group: : { 1-2:0-11, 6-8, 9,13-15,17-18:0-11, 19-21, down: 16}

Jul 8 17:05:23 tme-14(id20) /boot/kernel/kernel: [gmp_info.c:510](pid 1066=”kt: gmp-merge”) new group: : { 1-2:0-11, 6-8, 9,13-15:0-11, 16:0,2-12, 17-18:0-11, 19-21}

First, run the isi_nodes “%{name}: LNN %{lnn}, Array ID %{id}” to map the cluster’s node names to their respective Array IDs.

Before the cluster node outage event on Jul 8, we can see there was a group change on Jul 3

Jul 8 14:54:00 tme-14(id20) /boot/kernel/kernel: [gmp_info.c:510](pid 1060=”kt: gmp-merge”) new group: : { 1-2:0-11, 6-8, 9,13-15:0-11, 16:0,2-12, 17-18:0-11, 19-21, diskless: 6-8, 19-21 }

After that, all nodes came back online, and the cluster could be considered healthy. The cluster contains six accelerators, and all nine data nodes with twelve drives apiece. Since the Array IDs now extend to 21, and Array IDs 3 through 5 and 10 through 12 are missing, this confirms that six nodes were added or removed from the cluster.

So, the first event occurs at 16:44:38 on 8 July:

Jul 8 16:44:38 tme-14(id20) /boot/kernel/kernel: [gmp_info.c:510](pid 1060=”kt: gmp-split”) new group: : { 1-2:0-11, 6-8, 13-15:0-11, 16:0,2-12, 17- 18:0-11, 19-21, down: 9, diskless: 6-8, 19-21 }

Node 14 identifies Array ID 9 (LNN 6) as having left the group.

Next, twenty seconds later, two more nodes (2 & 15) show as offline:

Jul 8 16:44:58 tme-14(id20) /boot/kernel/kernel: [gmp_info.c:510](pid 1066=”kt: gmp-split”) new group: : { 1:0-11, 6-8, 13-14:0-11, 16:0,2-12, 17- 18:0-11, 19-21, down: 2, 9, 15, diskless: 6-8, 19-21 }

Twenty-two seconds later, another node goes offline:

Jul 8 16:45:20 tme-14(id20) /boot/kernel/kernel: [gmp_info.c:510](pid 1066=”kt: gmp-split”) new group: : { 1:0-11, 6-8, 14:0-11, 16:0,2-12, 17-18:0- 11, 19-21, down: 2, 9, 13, 15, diskless: 6-8, 19-21 }

At this point, four nodes (2,6,7, & 9) are marked as being offline:

Nearly two minutes later, the previously down node (node 6) rejoins:

Jul 8 16:47:09 tme-14(id20) /boot/kernel/kernel: [gmp_info.c:510](pid 1066=”kt: gmp-merge”) new group: : { 1:0-11, 6-8, 9,14:0-11, 16:0,2-12, 17- 18:0-11, 19-21, down: 2, 13, 15, diskless: 6-8, 19-21 }

Twenty-five seconds after node 6 comes back, however, node 1 goes offline:

Jul 8 16:47:27 tme-14(id20) /boot/kernel/kernel: [gmp_info.c:510](pid 1066=”kt: gmp-split”) new group: : { 6-8, 9,14:0-11, 16:0,2-12, 17-18:0-11, 19-21, down: 1-2, 13, 15, diskless: 6-8, 19-21 }

Finally, the group returns to the same as the original group:

Jul 8 17:05:23 tme-14(id20) /boot/kernel/kernel: [gmp_info.c:510](pid 1066=”kt: gmp-merge”) new group: : { 1-2:0-11, 6-8, 9,13-15:0-11, 16:0,2-12, 17-18:0-11, 19-21, diskless: 6-8, 19-21 }

As such, a timeline of this cluster event could read:

Jul 8 16:44:38 6 down

Jul 8 16:44:58 2, 9 down (6 still down)

Jul 8 16:45:20 7 down (2, 6, 9 still down)

Jul 8 16:47:09 6 up (2, 7, 9 still down)

Jul 8 16:47:27 1 down (2, 7, 9 still down)

Jul 8 16:48:11 12 down (1, 2, 7, 9 still down)

Jul 8 16:50:55 7 up (1, 2, 9, 12 still down)

Jul 8 16:51:26 2 up (1, 9, 12 still down)

Jul 8 16:51:53 9 up (1, 12 still down)

Jul 8 16:54:06 1 up (12 still down)

Jul 8 16:56:10 12 up (none down)

Jul 8 16:59:54 10 down

Jul 8 17:05:23 10 up (none down)

Before triangulating log events across multiple nodes, it’s important to ensure that the nodes’ clocks are all synchronized. To check this, run the isi_for_array –q date command on all nodes and confirm that they match. If not, apply the time offset for a particular node to the timestamps of its logfiles.

So what caused node 6 to go offline at 16:44:38? The messages file for that node show that nothing of note occurred between noon on Jul 8 and 16:44:31. After this, a slew of messages were logged:

Jul 8 16:44:31 tme-tme-6(id9) /boot/kernel/kernel: [rbm_device.c:749](pid 132=”swi5: clock sio”) ping failure (1)

Jul 8 16:44:31 tme-tme-6(id9) /boot/kernel/kernel: last 3 messages out: GMP_NODE_INFO_UPDATE, GMP_NODE_INFO_UPDATE, LOCK_REQ

Jul 8 16:44:31 tme-tme-6(id9) /boot/kernel/kernel: last 3 messages in : LOCK_RESP, TXN_COMMITTED, TXN_PREPARED

These three messages are repeated several times and then node 6 splits:

Jul 8 16:44:31 tme-tme-6(id9) /boot/kernel/kernel: [rbm_device.c:749](pid 132=”swi5: clock sio”) ping failure (21)

Jul 8 16:44:31 tme-tme-6(id9) /boot/kernel/kernel: last 3 messages out: GMP_NODE_INFO_UPDATE, GMP_NODE_INFO_UPDATE, LOCK_RESP

Jul 8 16:44:31 tme-6(id9) /boot/kernel/kernel: last 3 messages in : LOCK_REQ, LOCK_RESP, LOCK_RESP

Jul 8 16:44:34 tme-6(id9) /boot/kernel/kernel: [gmp_info.c:650](pid 48538=”kt: disco-cbs”) disconnected from node 1

Jul 8 16:44:34 tme-6(id9) /boot/kernel/kernel: [gmp_info.c:650](pid 49215=”kt: disco-cbs”) disconnected from node 2

Jul 8 16:44:34 tme-6(id9) /boot/kernel/kernel: [gmp_info.c:650](pid 50864=”kt: disco-cbs”) disconnected from node 6

Jul 8 16:44:34 tme-6(id9) /boot/kernel/kernel: [gmp_info.c:650](pid 49114=”kt: disco-cbs”) disconnected from node 7

Jul 8 16:44:34 tme-6(id9) /boot/kernel/kernel: [gmp_info.c:650](pid 30433=”kt: disco-cbs”) disconnected from node 8

Jul 8 16:44:34 tme-6(id9) /boot/kernel/kernel: [gmp_info.c:650](pid 49218=”kt: disco-cbs”) disconnected from node 13

Jul 8 16:44:34 tme-6(id9) /boot/kernel/kernel: [gmp_info.c:650](pid 50903=”kt: disco-cbs”) disconnected from node 14

Jul 8 16:44:34 tme-6(id9) /boot/kernel/kernel: [gmp_info.c:650](pid 24705=”kt: disco-cbs”) disconnected from node 15

Jul 8 16:44:34 tme-6(id9) /boot/kernel/kernel: [gmp_info.c:650](pid 48574=”kt: disco-cbs”) disconnected from node 16

Jul 8 16:44:34 tme-6(id9) /boot/kernel/kernel: [gmp_info.c:650](pid 49508=”kt: disco-cbs”) disconnected from node 17

Jul 8 16:44:34 tme-6(id9) /boot/kernel/kernel: [gmp_info.c:650](pid 52977=”kt: disco-cbs”) disconnected from node 18

Jul 8 16:44:34 tme-6(id9) /boot/kernel/kernel: [gmp_info.c:650](pid 52975=”kt: disco-cbs”) disconnected from node 19

Jul 8 16:44:34 tme-6(id9) /boot/kernel/kernel: [gmp_info.c:650](pid 50902=”kt: disco-cbs”) disconnected from node 20

Jul 8 16:44:34 tme-6(id9) /boot/kernel/kernel: [gmp_info.c:650](pid 48513=”kt: disco-cbs”) disconnected from node 21

Jul 8 16:44:34 tme-6(id9) /boot/kernel/kernel: [gmp_rtxn.c:194](pid 48513=”kt: gmp-split”) forcing disconnects from { 1, 2, 6, 7, 8, 13, 14, 15, 16, 17, 18, 19, 20, 21 }

Jul 8 16:44:50 tme-6(id9) /boot/kernel/kernel: [gmp_info.c:510](pid 48513=”kt: gmp-split”) new group: : { 9:0-11, down: 1-2, 6-8, 13-21, diskless: 6-8, 19-21 }

Node 6 splits from the rest of the nodes, then rejoins the rest of the cluster without a reboot.

Review messages logs for other nodes

After grabbing the pertinent node state and event info from the /var/log/messages logs for all fifteen nodes, a final timeline could read:

Jul 8 16:44:38 6 down

6: *** – split, not rebooted. Network issue? No engine stalls1 at that time…

Jul 8 16:44:58 2, 9 down (6 still down)

2: Softwatch timed out

9: Softwatch timed out

Jul 8 16:45:20 7 down (2, 6, 9 still down)

7: Indeterminate transactions

Jul 8 16:47:09 6 up (2, 7, 9 still down)

Jul 8 16:47:27 1 down (2, 7, 9 still down)

1: Softwatch timed out

Jul 8 16:48:11 12 down (1, 2, 7, 9 still down)

12: Softwatch timed out

Jul 8 16:50:55 7 up (1, 2, 9, 12 still down)

Jul 8 16:51:26 2 up (1, 9, 12 still down)

Jul 8 16:51:53 9 up (1, 12 still down)

Jul 8 16:54:06 1 up (12 still down)

Jul 8 16:56:10 12 up (none down)

Jul 8 16:59:54 10 down

10: Indeterminate transactions

Jul 8 17:05:23 10 up (none down)

Note: The BAM (block allocation manager) is responsible for building and executing a ‘write plan’ of which blocks should be written to which drives on which nodes for each transaction. OneFS logs an engine stall if this write plan encounters an unexpected delay.

Because group changes document the cluster’s actual configuration from OneFS’ perspective, they’re a vital tool in understanding at any point in time which devices the cluster considers available, and which devices the cluster considers as having failed. This info, when combined with other data from cluster logs, can provide a succinct but detailed cluster history, simplifying both debugging and failure analysis.

Cluster Composition and the OneFS GMP

By popular request, we’ll explore the topic of cluster state changes and quorum over the next couple of blog articles .

In computer science, Brewer’s CAP theorem states that it’s impossible for a distributed system to simultaneously guarantee consistency, availability, and partition tolerance. This means that, when faced with a network partition, one has to choose between consistency and availability.

OneFS does not compromise on consistency, so a mechanism is required to manage a cluster’s transient state and quorum.  As such, the primary role of the OneFS Group Management Protocol (GMP) is to help create and maintain a group of synchronized nodes. Having a consistent view of the cluster state is critical, since initiators need to know which node and drives are available to write to, etc. A group is a given set of nodes which have synchronized state, and a cluster may form multiple groups as connection state changes. GMP distributes a variety of state information about nodes and drives, from identifiers to usage statistics. The most fundamental of these is the composition of the cluster, or ‘static aspect’ of the group, which is stored in the array.xml file. The array.xml file also includes info such as the ID, GUID, and whether the node is diskless or storage, plus attributes not considered part of the static aspect, such as internal IP addresses.

Similarly, the state of a node’s drives is stored in the drives.xml file, along with a flag indicating whether the drive is an SSD. Whereas GMP manages node states directly, drive states are actually managed by the ‘drv’ module, and broadcast via GMP. A significant difference between nodes and drives is that for nodes, the static aspect is distributed to every node in the array.xml file, whereas drive state is only stored locally on a node. The array.xml information is needed by every node in order to define the cluster and allow nodes to form connections. In contrast, drives.xml is only stored locally on a node. When a node goes down, other nodes have no method to obtain the drive configuration of that node. Drive information may be cached by the GMP, but it is not available if that cache is cleared.

Conversely, ‘dynamic aspect’ refers to the state of nodes and drives which may change. These states indicate the health of nodes and their drives to the various file system modules – plus whether or not components can be used for particular operations. For example, a soft-failed node or drive should not be used for new allocations. These components can be in one of seven states:

  • UP The component is responding.
  • DOWN The component is not responding.
  • DEAD The component is not allowed to come back to the UP state and should be removed.
  • STALLED A drive is responding slowly.
  • GONE The component has been removed.
  • Soft-failed The component is in the process of being removed.
  • Read-only This state only applies to nodes.

Note: A node or drive may go from ‘down, soft-failed’ to ‘up, soft-failed’ and back. These flags are persistently stored in the array.xml file for nodes and the drives.xml file for drives.

Group and drive state information allows the various file system modules to make timely and accurate decisions about how they should utilize nodes and drives. For example, when reading a block, the selected mirror should be on a node and drive where a read can succeed (if possible). File system modules use the GMP to test for node and drive capabilities, which include:

  • Readable                 Drives on this node may be read.
  • Writable                  Drives on this node may be written to.
  • Restripe From      Move blocks away from the node.

Access levels help define ‘as a last resort’ with states for which access should be avoided unless necessary. The access levels, in order of increased access, are as follows:

  • Normal                     The default access level.
  • Read Stalled           Allows reading from stalled drives.
  • Modify Stalled      Allows writing to stalled drives.
  • Read Soft-fail       Allows reading from soft-failed nodes and drives.
  • Never                        Indicates a group state never supports the capability.

Drive state and node state capabilities are shown in the following tables. As shown, the only group states affected by increasing access levels are soft-failed and stalled.

 Minimum Access Level for Capabilities Per Node State

Node States Readable Writeable Restripe From
UP Normal Normal No
UP, Smartfail Soft-fail Never Yes
UP, Read-only Normal Never No
UP, Smartfail, Read-only Soft-fail Never Yes
DOWN Never Never No
DOWN, Smartfail Never Never Yes
DOWN, Read-only Never Never No
DOWN, Smartfail, Read-only Never Never Yes
DEAD Never Never Yes

Minimum Access Level for Capabilities Per Drive State

Drive States Minimum Access Level to Read Minimum Access Level to Write Restripe From
UP Normal Normal No
UP, Smartfail Soft-fail Never Yes
DOWN Never Never No
DOWN, Smartfail Never Never Yes
DEAD Never Never Yes
STALLED Read_Stalled Modify_Stalled No

OneFS depends on a consistent view of a cluster’s group state. For example, some decisions, such as choosing lock coordinators, are made assuming all nodes have the same coherent notion of the cluster.

Group changes originate from multiple sources, depending on the particular state. Drive group changes are initiated by the drv module. Service group changes are initiated by processes opening and closing service devices. Each group change creates a new group ID, comprising a node ID and a group serial number. This group ID can be used to quickly determine whether a cluster’s group has changed, and is invaluable for troubleshooting cluster issues, by identifying the history of group changes across the nodes’ log files.

GMP provides coherent cluster state transitions using a process similar to two-phase commit, with the up and down states for nodes being directly managed by the GMP. RBM or Remote Block Manager code provides the communication channel that connect devices in the OneFS. When a node mounts /ifs it initializes the RBM in order to connect to the other nodes in the cluster, and uses it to exchange GMP Info, negotiate locks, and access data on the other nodes.

Before /ifs is mounted, a ‘cluster’ is just a list of MAC and IP addresses in array.xml, managed by ibootd when nodes join or leave the cluster. When mount_efs is called, it must first determine what it‘s contributing to the file system, based on the information in drives.xml. After a cluster (re)boot, the first node to mount /ifs is immediately placed into a group on its own, with all other nodes marked down. As the Remote Block Manager (RBM) forms connections, the GMP merges the connected nodes, enlarging the group until the full cluster is represented. Group transactions where nodes transition to UP are called a ‘merge’, whereas a node transitioning to down is called a split. Several file system modules must update internal state to accommodate splits and merges of nodes. Primarily, this is related to synchronizing memory state between nodes.

The soft-failed, read-only, and dead states are not directly managed by the GMP. These states are persistent and must be written to array.xml accordingly. Soft-failed state changes are often initiated from the user interface, for example via the ‘isi devices’ command.

A GMP group relies on cluster quorum to enforce consistency across node disconnects. By requiring ⌊N/2⌋+1 replicas to be available, this ensures that no updates are lost. Since nodes and drives in OneFS may be readable, but not writable, OneFS has two quorum properties:

  • Read quorum
  • Write quorum

Read quorum is governed by having [N/2] + 1 nodes readable, as indicated by sysctl efs.gmp.has_quorum. Similarly, write quorum requires at least [N/2] + 1 writeable nodes, as represented by the sysctl efs.gmp.has_super_block_quorum. A group of nodes with quorum is called the ‘majority’ side, whereas a group without quorum is a ‘minority’. By definition, there can only be one ‘majority’ group, but there may be multiple ‘minority’ groups. A group which has any components in any state other than up is referred to as degraded.

File system operations typically query a GMP group several times before completing. A group may change over the course of an operation, but the operation needs a consistent view. This is provided by the group info, which is the primary interface modules use to query group state. The current group info can be viewed via the sysctl efs.gmp.current_info command. It includes the GMP’s group state, but also information about services provided by nodes in the cluster. This allows nodes in the cluster to discover when services change state on other nodes and take the appropriate action when this happens. An example is SMB lock expiry, which uses GMP service information to clean up locks held by other nodes when the service owning the lock goes down.

Processes change the service state in GMP by opening and closing service devices. A particular service will transition from down to up in the GMP group when it opens the file descriptor for a device. Closing the service file descriptor will trigger a group change that reports the service as down. A process can explicitly close the file descriptor if it chooses, but most often the file descriptor will remain open for the duration of the process and closed automatically by the kernel when it terminates.

An understanding of OneFS groups and their related group change messages allows you to determine the current health of a cluster – as well as reconstruct the cluster’s history when troubleshooting issues that involve cluster stability, network health, and data integrity. We’ll explore the reading and interpretation of group change status data in the second part of this blog article series.

OneFS and IPMI

First introduced in version 9.0, OneFS provides support for IPMI, the Intelligent Platform Management Interface protocol. IPMI allows out-of-band console access and remote power control across a dedicated ethernet interface via Serial over LAN (SoL). As such, IMPI provides true lights-out management for PowerScale F-series all-flash nodes and Gen6 H-series and A-series chassis without the need for additional rs-232 serial port concentrators or PDU rack power controllers.

For example, IPMI enables individual nodes or the entire cluster to be powered on after maintenance or a power outage. For example:

  • Power off nodes or the cluster, such as after a power outage and when the cluster is operating on backup power.
  • Perform a Hard/Cold Reboot/Power Cycle, for example, if a node is unresponsive to OneFS.

IPMI is disabled by default in OneFS 9.0 and later, but can be easily enabled, configured, and operated from the CLI via the new ‘isi ipmi’ command set.

A cluster’s console can easily be accessed using the IPMItool utility, available as part of most Linux distributions, or accessible through other proprietary tools. For the PowerScale F900, F600 and F200 platforms, the Dell iDRAC remote console option can be accessed via an https web browser session to the default port 443 at a node’s IPMI address.

Note that support for IPMI on Isilon Generation 6 hardware requires node firmware package 10.3.2 and SSP firmware 02.81 or later.

With OneFS 9.0 and later, IPMI is fully supported on both PowerScale Gen6 H-series and A-series chassis-based platforms, and PowerScale all-flash F-series platforms. For Gen6 nodes running 8.2.x releases, IPMI is not officially supported but does generally work.

IPMI can be configured for DHCP, static IP, or a range of IP addresses. With the range option, IP addresses are allocated on a first-available basis and be cannot assign a specific IP address to a specific node. For security purposes, the recommendation is to restrict IPMI traffic to a dedicated, management-only VLAN.

A single username and password is configured for IPMI management across all the nodes in a cluster using isi ipmi user modify — username= –set-password CLI syntax. Usernames can be up to 16 characters in length, and passwords must comprise 17-20 characters. To verify the username configuration, use isi ipmi user view.

Be aware that a node’s physical serial port is disabled when a SoL session is active, but becomes re-enabled when the SoL session is terminated with the ‘deactivate’ command option.

In order to run the OneFS IPMI commands, the administrative account being used must have the RBAC ISI_PRIV_IPMI privilege.

The following CLI syntax can be used to enable IPMI for DHCP:

# isi ipmi settings modify --enabled=True --allocation-type=dhcp 35 426 IPMI

Simiarly, to enable IPMI for a static IP address:

# isi ipmi settings modify --enabled=True --allocation-type=static

To enable IPMI for a range of IP addresses use:

# isi ipmi network modify --gateway=[gateway IP] --prefixlen= --ranges=[IP Range]

The power control and Serial over LAN features can be configured and viewed using the following CLI command syntax. For example:

# isi ipmi features list

ID            Feature Description           Enabled
----------------------------------------------------
Power-Control Remote power control commands Yes

SOL           Serial over Lan functionality Yes
----------------------------------------------------

To enable the power control feature:

# isi ipmi features modify Power-Control --enabled=True

To enable the Serial over LAN (SoL) feature:

# isi ipmi features modify SOL --enabled=True

The following CLI commands can be used to configure a single username and password to perform IPMI tasks across all nodes in a cluster. Note that usernames can be up to 16 characters in length, while the associated passwords must be 17-20 characters in length.

To configure the username and password, run the CLI command:

# isi ipmi user modify --username [Username] --set-password

To confirm the username configuration, use:

# isi ipmi user view

Username: power

In this case, the user ‘power’ has been configured for OneFS IPMI control.

On the client side, the ‘ipmiItool’ command utility is ubiquitous in the Linux and UNIX world, and is included natively as part of most distributions. If not, it can easily be installed using the appropriate package manager, such as ‘yum’.

The ipmitool usage syntax is as follows:

[Linux Host:~]$ ipmitool -I lanplus -H [Node IP] -U [Username] -L OPERATOR -P [password]

For example, to execute power control commands:

ipmitool -I lanplus -H [Node IP] -U [Username] -L OPERATOR -P [password] power [command]

The ‘power’ command options above include status, on, off, cycle, and reset.

And, similarly, for Serial over LAN:

ipmitool -I lanplus -H [Node IP] -U [Username] -L OPERATOR -P [password] sol [command]

The serial over LAN ‘command’ options include info, activate, and deactivate.

Once active, a Serial over LAN session can easily be exited using the ‘tilde dot’ command syntax, as follows:

# ~.

On PowerScale F600 and F200 nodes, the remote console can be accessed via the Dell iDRAC by browsing to https://<node_IPMI_IP_address>:443 and, unless it’s been changed, using the default password of root/calvin.

Double clicking on the ‘Virtual Console’ image on the bottom right of the iDRAC main page above brings up a full-size console window:

From here, authenticate using your preferred cluster username and password for full out-of-band access to the OneFS console.

When it comes to troubleshooting OneFS IPMI, a good place to start is by checking that the daemon is enabled. This can be done using the following CLI command:

# isi services -a | grep -i ipmi_mgmt

isi_ipmi_mgmt_d      Manages remote IPMI configuration        EnabledTroubleshooting & Firmware

The IPMI management daemon, isi_ipmi_mgmt_d, can also be run with a variety of options including the -s flag to list the current IPMI settings across the cluster, the -d flag to enable debugging output, etc, as follows:

# /usr/bin/isi_ipmi_mgmt_d -h

usage: isi_ipmi_mgmt_d [-h] [-d] [-m] [-s] [-c CONFIG]

Daemon that manages the remote IPMI configuration.

optional arguments:

-h, --help            show this help message and exit

-d, --debug           Enable debug logging

-m, --monitor         Launch the remote IPMI monitor daemon

-s, --show            Show the remote IPMI settings

-c CONFIG, --config CONFIG

Configure IPMI management settings

IPMI writes errors, warnings, etc, to its log file, located at /var/log/isi_ipmi_mgmt_d.log, and which includes a host of useful troubleshooting information.