Another feature introduced in the OneFS 9.14 release is CELOG Bulk Event Resolution. But before we get into the details, first, a quick refresher. The OneFS Cluster Event Log (or CELOG) provides a single source for the logging of events that occur on a PowerScale cluster. Events are used to communicate a picture of cluster health for various components. CELOG provides a single point from which notifications about the events are generated, including sending alert emails and SNMP traps.
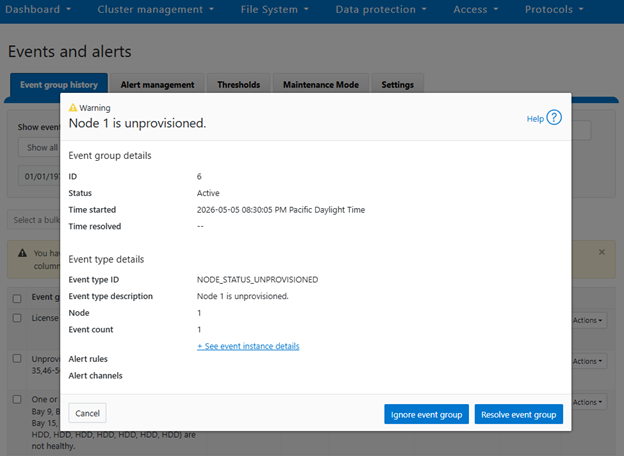
Cluster events can be easily viewed from the WebUI by browsing to Cluster Management > Events and Alerts > Events group history. For example:
Or from the CLI, using the ‘isi event events view’ syntax:
# isi event events view 2.370158

           ID: 2.370158

Eventgroup ID: 271428

   Event Type: 600010001

      Message: The snapshot daemon failed to create snapshot 'Hourly - prod' in schedule 'Hourly @ Every Day': error: Name collision

        Devid: 2

          Lnn: 2

         Time: 2026-05-08T17:01:33

     Severity: warning

        Value: 0.0
In the above instance, CELOG communicates on behalf of SnapshotIQ that it’s failed to create a scheduled hourly snapshot because of an issue with the naming convention.
At a high level, processes that monitor conditions on the cluster or log important events during the course of their operation communicate directly with the CELOG system. CELOG receives event messages from other processes via a well-defined API.
A CELOG event often contains the following elements:
| Element | Definition |
| Event | Events are generated by the system and may be communicated in various ways (email, snmp traps, etc), depending upon the configuration. |
| Specifier | Specifiers are strings containing extra information, which can be used to coalesce events and construct meaningful, readable messages. |
| Attachment | Extra chunks of information, such as parts of log files or sysctl output, added to email notifications to provide additional context about an event. |
For example, in SnapshotIQ event above, we can see the event text contains a specifier and attachment that has been mostly derived from the corresponding syslog message:
# grep "Hourly - prod" /var/log/messages* | grep "2026-05-08T17:01:33"

2026-05-08T17:01:33-04:00 <3.3> a200-2 isi_snapshot_d[5631]: create_schedule_snapshot: snapshot schedule (Hourly @ Every Day) pattern created a snapshot name collision (Hourly - prod); scheduled create failed.
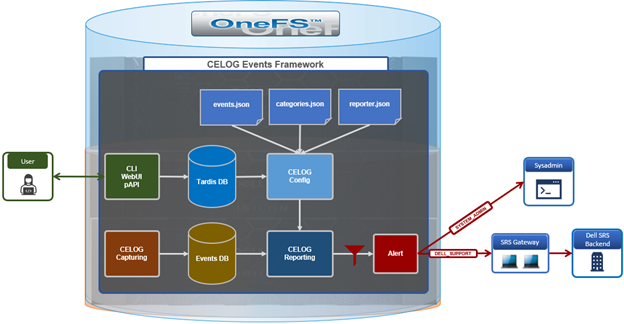
CELOG is a large, complex system, which can be envisioned as a large pipeline. It gathers events and statistics info on one end from isi_stats_d and isi_celog_monitor, plus directly other applications such as SmartQuotas, SyncIQ, etc. These events are passed from one functional block to another, with a database at the end of the pipe. Along the way, attachments may be generated, notifications sent, and events passed to a coalescer.
On the front end, there are two dispatchers, which pass communication from the UNIX socket and network to their corresponding handlers. As events are processed, they pass through a series of coalescers. At any point they may be intercepted by the appropriate coalescer, which creates a coalescing event and which will accept other related events.
As events drop out the bottom of the coalescer stack, they’re deposited in add, modify and delete queues in the backend database infrastructure. The coalescer thread then moves onto pushing things into the local database, forwarding them along to the master coalescer, and queueing events to have notifications sent and/or attachments generated.
The processes of safely storing events, analyzing them, deciding on what alerts to send and sending them is separated into four separate modules within the pipeline:

The following table provides a description of each of these CELOG modules:
| Component | Definition |
| Capture | The first stage in the processing pipeline, Event Capture is responsible for reading event occurrences from the kernel queue, storing them safely on persistent local storage, generating attachments, and queueing them by priority for analysis. |
| Analysis | Extra chunks of information (log file extracts, sysctl output, etc) are added to alert notifications to provide additional context about an event. |
| Reporter | The Reporter is the third stage in the processing pipeline, and runs on only one node in the cluster. It periodically queries Event Analysis for changes and generates alert requests for any relevant conditions. |
| Alerter | The Alerter is the final stage in the processing pipeline, responsible for actually delivering the alerts requested by the reporter. There is a single sender for each enabled channel on the cluster. |
CELOG local and backend database redundancy ensures reliable event storage and guards against bottlenecks.
By default, OneFS provides the following event group categories, each of which contain a variety of conditions, or ‘event group causes’, which will trigger an event if their conditions are met:
| Event Group Category | Event Series Number |
| System disk events | 1000***** |
| Node status events | 2000***** |
| Reboot events | 3000***** |
| Software events | 4000***** |
| Quota events | 5000***** |
| Snapshot events | 6000***** |
| Windows networking events | 7000***** |
| Filesystem events | 8000***** |
| Hardware events | 9000***** |
| CloudPools events | 11000***** |
Prior to OneFS 9.14 and the introduction of CELOG bulk event resolution, cluster events were handled individually, resulting in excessive parallel API calls, frequent timeouts, repeated database commits, and increased lock contention, which constrained system scalability under high event volumes and degraded the user experience through delays, failures, and additional manual verification. Bulk Event Resolution addresses these limitations by processing multiple events within a single atomic transaction in which all changes either succeed or fail together, ensuring data integrity while minimizing redundant API activity and providing consistent rollback on failure. This capability significantly reduces database lock contention, improves stability and throughput during high event loads, and accelerates the completion of administrative operations. The feature is fully integrated across the WebUI, PAPI, and CLI, enabling consistent interactive, programmatic, and script‑driven workflows, and delivering a more reliable and efficient operational experience with reduced need for manual validation.
Under the hood, CELOG has the following high level architecture:
The CELOG bulk resolve workflow itself operates as follows:
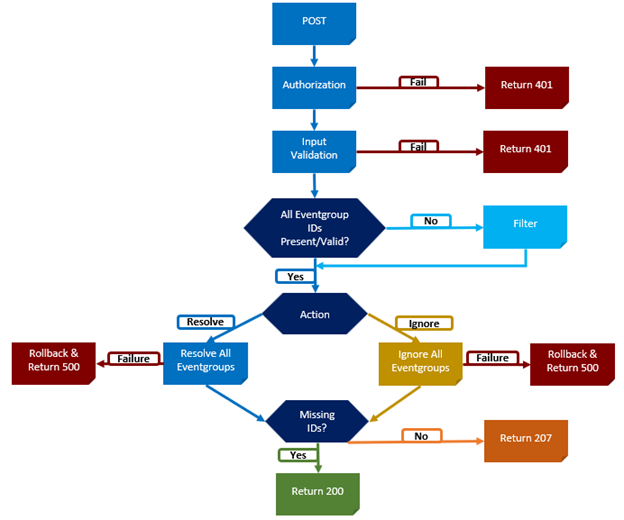
Both the WebUI and CLI route bulk event requests through the isi_papi_d service, where the event occurrences handler orchestrates the overall operation. The handler begins by authenticating the request and validating the input, then verifies all provided event group IDs and filters out any that are invalid. Only confirmed IDs are allowed to proceed, and these are deterministically grouped and executed together within a single transaction. The workflow is initiated through a request to the bulk endpoint, and the remaining valid events are processed as part of one automated transaction. If all steps complete successfully, the API returns a success response; if any step fails, the transaction is rolled back and an appropriate error is returned. No additional configuration is required, as bulk resolution leverages the existing PUT API and follows the same authentication and permission model. When multiple event IDs are supplied as an array, the backend automatically processes them in bulk mode, without requiring feature flags, database changes, or service configuration updates.
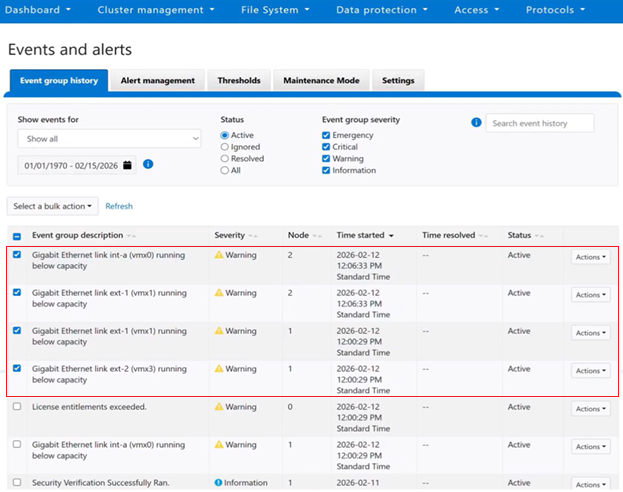
Bulk event actions can be managed from the OneFS WebUI under ‘Cluster management > Events and alerts > Event group history’:
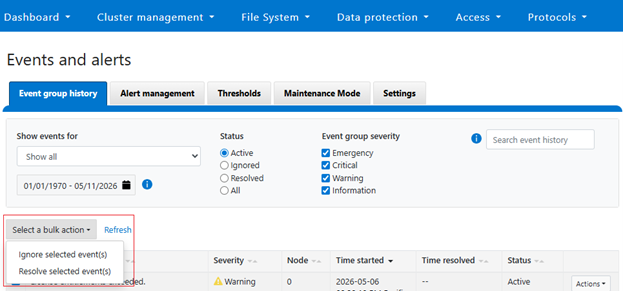
Multiple event groups can be selected and resolved or ignored as a single collective action:
Or from the OneFS ClI using the following syntax:
# isi event groups bulk -–resolved true -–eventgroup_ids=<x,x,x,...>
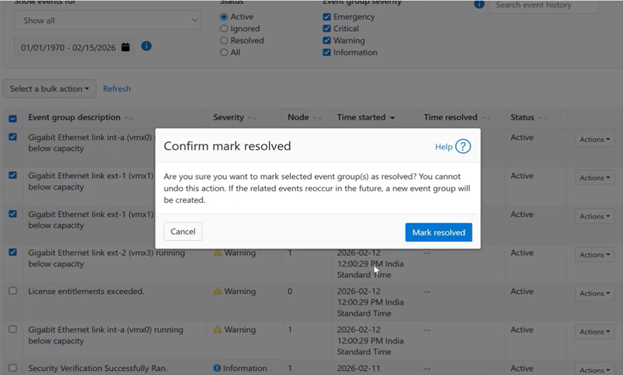
After the action is confirmed, the WebUI submits the bulk request and processes it asynchronously in the background:
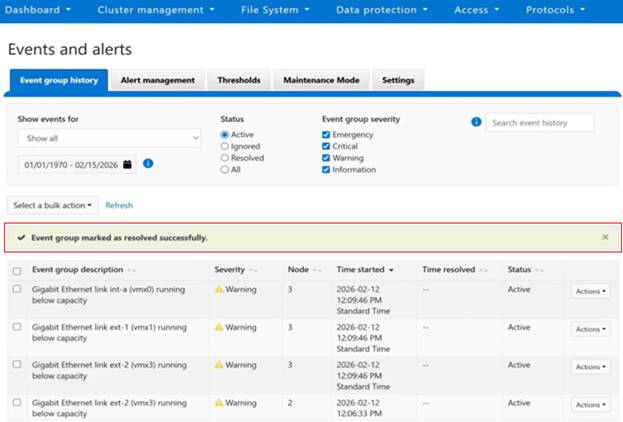
Upon successful completion of the bulk resolution operation, the WebUI displays a success banner to confirm the result:
If the request includes invalid event IDs, those IDs are filtered out during validation, and the response clearly identifies which events were successfully resolved and which were skipped. For example, from the CLI:
# isi event groups bulk -–resolved true -–eventgroup_ids=55,56,250

Resolved event-groups: 55,56

Skipped event-groups: 250

#
By consolidating processing into a single atomic operation, redundant requests are eliminated, performance is improved, and consistent, reliable outcomes are maintained even under high‑load conditions. This approach delivers a faster experience for cluster administrators, increases overall system resilience, and simplifies end‑to‑end automation.
If a bulk request fails, begin by confirming that the payload includes a valid array of event IDs and that the appropriate permissions are in place. Next, review the API log messages at /var/log/isi_papi_d.log. Because execution is atomic for the validated set, any failure during processing triggers a rollback of the entire transaction, with the API response and logs providing clear indicators of the underlying cause.