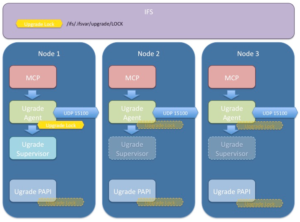
Affectionately named after TRON’s ‘Master Control Program’, MCP is OneFS’ main utility for distributed service control across a cluster. MCP is responsible for starting, monitoring, and restarting failed services on a cluster. It also monitors configuration files and acts upon configuration changes, propagating local file changes to the rest of the cluster. As such, it performs a similar function to the Windows ‘service control manager’ (SCM) or MacOS ‘launchd’.
MCP is actually comprised of three different processes, one for each of its modes:
- Master
- Failsafe
- Forker
These can be seen when viewing the running processes on a healthy node:
# ps -auxw | grep -i mcp | grep -v grep

root    5400    0.4  0.0  60760  19928  -  Ss   11Jun21    170:08.18 isi_mcp: master (isi_mcp)

root    5179    0.0  0.0  32760  13632  -  Is   11Jun21      0:00.01 isi_mcp: failsafe (isi_mcp)

root    5181    0.0  0.0  31476  12572  -  Is   11Jun21      0:00.36 isi_mcp: forker (isi_mcp)
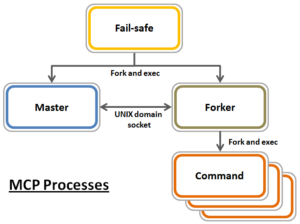
The ‘Master’ is the central MCP process and does the bulk of the work. It monitors files and services, including the failsafe process, and delegates actions to the forker process.
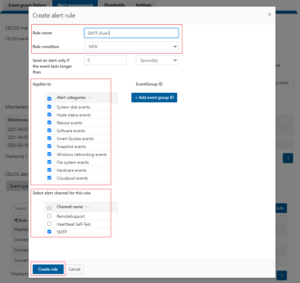
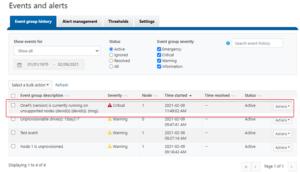
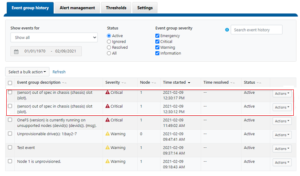
The role of the ‘Forker’ is to receive command-line actions from the master, execute them, and return the resulting exit codes. It receives actions from the master process over a UNIX domain socket. If the forker is inadvertently or intentionally killed, it’s automatically restarted by the master process. If necessary, MCP will continue trying to restart the forker at an increasing interval. If, after around ten minutes of unsuccessfully attempting to restart the forker, MCP will fire off a CELOG alert, and continue trying. A second alert would then be sent after thirty minutes.
The ‘Failsafe’ process is responsible for starting, monitoring, restarting, and stopping both the Master and Forker. It’s a single threaded process that, if killed, will shut down all three MCP services. If this occurs, the three services will stay down until they are restarted with the ‘isi_mcp’ CLI command. If the master fails and can’t be restarted, MCP will continue attempting to restart it and fire alerts in the same manner as described above for the forker service.
MCP monitors the following files:
| File Type | Function |
| /etc/mcp/sys/files/* | Configuration files monitored by MCP. |
| /etc/mcp/sys/services/* | Services that MCP starts and monitors. |
| /etc/ifs/array.xml | Cluster configuration file. |
| /etc/mcp/override/* | All files in override directory propagated to all nodes and entered in global mlist. |
| /etc/mcp/mlist.xml | Local mlist (mlists are used to manage and track the above files) |
| /ifs/.ifsvar/etc/mcp/mlist.xml | Master mlist |
The following command will list the open files that MCP is currently monitoring on a node:
# for i in `sysctl efs.bam.busy_vnodes | grep -i mcp | awk '{print $4}' | sed -E 's/)//'`; do isi get -L $i | awk '{print $8}'; done
MCP monitors the configuration files in /etc/mcp/sys/files. While monitoring the configuration files MCP does two things:
- Performs the file change action
- Propagates config file changes to other nodes
Consider the XML configuration file for the ndmpd service, for example:
# cat /etc/mcp/sys/services/ndmpd

<?xml version="1.0"?>

<service name="ndmpd" enable="0" display="1" options="require-quorum,kill-on-sigquorum,require-post-ifs">

      <isi-meta-tag id="ndmp_service">

        <mod-attribs>enable</mod-attribs>

      </isi-meta-tag>

      <description>Network Data Management Protocol Daemon</description>

      <process name="isi_ndmp_d" pidfile="/var/run/isi_ndmp_d.pid"

               startaction="start" stopaction="stop"/>

      <actionlist name="start">

        <action>/usr/bin/isi_ndmp_d</action>

      </actionlist>

      <actionlist name="stop">

        <action>/usr/bin/killall isi_ndmp_d</action>

      </actionlist>

</service>
Much of what MCP does in response to an event notification is defined by the ‘actionlist’ in a config file. This is simply a list of commands to be executed, with action lists for starting and stopping services, and also for specific configuration files changes (for example, importing a product license).
Many of the local configuration files need to be uniform across the cluster so, unless the ‘notify =0’ flag is set, the master process also copies changed files to /ifs for MCP on other nodes to use.
MCP starts and watches already running services in accordance with their service description files, stored under /etc/mcp/sys/services. These are XML files which describe how a service is to be started when enabled or stopped when disabled.
The XML file also lists under ‘options’ the conditions of the node and/or cluster that must be met before the service can be started (for example above, ‘require-quorum’ or ‘require-post-ifs’, etc).
When a service is monitored, MCP ensures the correct state of the service on a node. If a service is marked ‘enable’, MCP will run the start action until the PID confirms it as running. When a service is marked ‘disable’, MCP will kill the service via its PID. The full list of services and their current state can be viewed with the following CLI command:
# isi services -a
MCP monitors services by observing their PID files (under /var/run), plus the process table itself, to determine if a process is already running or not. It compares this state against the ‘enabled/disabled’ state for the service and determines whether any start or stop actions are required. Services may also be configured to terminate if the cluster loses quorum with the option ‘kill-on-sigquorum’ in their XML file.
Another type of configuration file that MCP monitors is also known as a service override file, which live under /etc/mcp/override. These override files are used to store any current settings for options which have been changed from the defaults. The override files are always shared across the cluster via MCP’s configuration propagation mechanism.
The Master MCP process creates merged lists, or mlists, that are used to track and coordinate the process of managing the XML config and service description files. There are two types of mlist: Local and Master. The master process will automatically create the local mlist at startup if it doesn’t already exist. However, the master mlist is created later since MCP starts and begins operations before /ifs is mounted.
Here’s the mlist entry for the cluster’s NTP service, for example:
    <file>

      <path>/etc/mcp/templates/ntp.conf</path>

      <md5>7772b5d50494c85043933321c21dbb8d</md5>

      <timestamp>1623466667</timestamp>

      <revision>1</revision>

      <array_id>1</array_id>

    </file>
The local mlist has an entry for every file identified in the MCP file configuration files (/etc/mcp/sys/files), an entry for every configuration file (/etc/mcp/sys/files & procs), an entry for an override file for each service (may or may not exist), an entry for /etc/ifs/array.xml. It also contains an entry for the master mlist (/ifs/.ifsvar/etc/mcp/mlist.xml).
# grep mlist.xml mlist.xml

      <path>/ifs/.ifsvar/etc/mcp/mlist.xml</path>
The mlist has an entry for every local file that’s shared across the cluster and the override service files. A coordinator lock file prevents different nodes from making changes to /ifs at the same time.
If MCP attempts to start a service and fails, as long as the service is enabled, it will wait for an interval before attempting to start the service again. This interval doubles in size each time, until it reaches 256 seconds then remains at this frequency.