The OneFS job engine is based on a map reduce model. Under the hood, it comprises a delegation hierarchy made up of coordinator, director, manager, and worker processes.
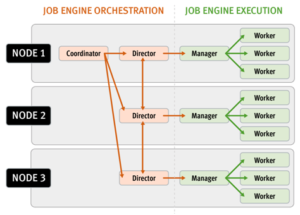
There are other threads which are not illustrated in the graphic, which relate to internal functions, such as communication between the various JE daemons, and collection of statistics. Also, with three jobs running simultaneously, each node would have three manager processes, each with its own number of worker threads.
Once the work is initially allocated, the job engine uses a shared work distribution model in order to execute the work, and each job is identified by a unique Job ID. When a job is launched, whether it’s scheduled, started manually, or responding to a cluster event, the Job Engine spawns a child process from the isi_job_d daemon running on each node. This job engine daemon is also known as the parent process.
The entire job engine’s orchestration is handled by the coordinator, which is a process that runs on one of the nodes in a cluster. Any node can act as the coordinator, and the principle responsibilities include:
- Monitoring workload and the constituent nodes’ status
- Controlling the number of worker threads per-node and cluster-wide
- Managing and enforcing job synchronization and checkpoints
While the actual work item allocation is managed by the individual nodes, the coordinator node takes control, divides up the job, and evenly distributes the resulting tasks across the nodes in the cluster. For example, if the coordinator needs to communicate with a manager process running on node five, it first sends a message to node five’s director, which then passes it on down to the appropriate manager process under its control. The coordinator also periodically sends messages, via the director processes, instructing the managers to increment or decrement the number of worker threads.
The coordinator is also responsible for starting and stopping jobs, and also for processing work results as they are returned during the execution of a job. Should the coordinator process die for any reason, the coordinator responsibility automatically moves to another node.
The coordinator node can be identified via the following CLI command:
# isi job status --verbose | grep Coordinator
Each node in the cluster has a job engine director process, which runs continuously and independently in the background. The director process is responsible for monitoring, governing and overseeing all job engine activity on a particular node, constantly waiting for instruction from the coordinator to start a new job. The director process serves as a central point of contact for all the manager processes running on a node, and as a liaison with the coordinator process across nodes. These responsibilities include:
- Manager process creation
- Delegating to and requesting work from other peers
- Sending and receiving status messages
The manager process is responsible for arranging the flow of tasks and task results throughout the duration of a job. The manager processes request and exchange work with each other and supervise the worker threads assigned to them. At any point in time, each node in a cluster can have up to three manager processes, one for each job currently running. These managers are responsible for overseeing the flow of tasks and task results.
Each manager controls and assigns work items to multiple worker threads working on items for the designated job. Under direction from the coordinator and director, a manager process maintains the appropriate number of active threads for a configured impact level, and for the node’s current activity level. Once a job has completed, the manager processes associated with that job, across all the nodes, are terminated. And new managers are automatically spawned when the next job is moved into execution.
The manager processes on each node regularly send updates to their respective node’s director, which, in turn, informs the coordinator process of the status of the various worker tasks.
Each worker thread is given a task, if available, which it processes item-by-item until the task is complete or the manager un-assigns the task. The status of the nodes’ workers can be queried by running the following CLI command:
# isi job statistics view
In addition to the number of current worker threads per node, a sleep to work (STW) ratio average is also provided, giving an indication of the worker thread activity level on the node.
Towards the end of a job phase, the number of active threads decreases as workers finish up their allotted work and become idle. Nodes which have completed their work items just remain idle, waiting for the last remaining node to finish its work allocation. When all tasks are done, the job phase is considered to be complete and the worker threads are terminated.
As jobs are processed, the coordinator consolidates the task status from the constituent nodes and periodically writes the results to checkpoint files. These checkpoint files allow jobs to be paused and resumed, either proactively, or in the event of a cluster outage. For example, if the node on which the Job Engine coordinator was running went offline for any reason, a new coordinator would be automatically started on another node. This new coordinator would read the last consistency checkpoint file, job control and task processing would resume across the cluster from where it left off, and no work would be lost.
Job engine checkpoint files are stored in ‘results’ and ‘tasks’ subdirectories under the path ‘/ifs/.ifsvar/modules/jobengine/cp/<job_id>/’ for a given job. On large clusters and/or with a job running at high impact, there can be many checkpoint files accessed from all nodes, which may result in contention. Checkpoints are split into sixteen subdirectories under both tasks and results to alleviate this bottleneck.
The Job Engine resource monitoring and execution framework allows jobs to be throttled based on both CPU and disk I/O metrics. The granularity of the resource utilization monitoring data provides the coordinator process with visibility into exactly what is generating IOPS on any particular drive across the cluster. This level of insight allows the coordinator to make very precise determinations about exactly where and how impact control is best applied. As we will see, the coordinator itself does not communicate directly with the worker threads, but rather with the director process, which in turn instructs a node’s manager process for a particular job to cut back threads.
For example, if the job engine is running a low-impact job and CPU utilization drops below the threshold, the worker thread count is gradually increased up to the maximum defined by the ‘low’ impact policy threshold. If client load on the cluster suddenly spikes for some reason, then the number of worker threads is gracefully decreased. The same principal applies to disk I/O, where the job engine will throttle back in relation to both IOPS as well as the number of I/O operations waiting to be processed in any drive’s queue. Once client load has decreased again, the number of worker threads is correspondingly increased to the maximum ‘low’ impact threshold.
In summary, detailed resource utilization telemetry allows the job engine to automatically tune its resource consumption to the desired impact level and customer workflow activity.
Certain jobs, if left unchecked, could consume vast quantities of a cluster’s resources, contending with and impacting client I/O. To counteract this, the Job Engine employs a comprehensive work throttling mechanism which is able to limit the rate at which individual jobs can run. Throttling is employed at a per-manager process level, so job impact can be managed both granularly and gracefully.
Every twenty seconds, the coordinator process gathers cluster CPU and individual disk I/O load data from all the nodes across the cluster. The coordinator uses this information, in combination with the job impact configuration, to decide how many threads may run on each cluster node to service each running job. This can be a fractional number, and fractional thread counts are achieved by having a thread sleep for a given percentage of each second.
Using this CPU and disk I/O load data, every sixty seconds the coordinator evaluates how busy the various nodes are and makes a job throttling decision, instructing the various job engine processes as to the action they need to take. This enables throttling to be sensitive to workloads in which CPU and disk I/O load metrics yield different results. Additionally, there are separate load thresholds tailored to the different classes of drives utilized in OneFS powered clusters, including high speed SAS drives, lower performance SATA disks and flash-based solid-state drives (SSDs).
The Job engine allocates a specific number of threads to each node by default, thereby controlling the impact of a workload on the cluster. If little client activity is occurring, more worker threads are spun up to allow more work, up to a predefined worker limit. For example, the worker limit for a low-impact job might allow one or two threads per node to be allocated, a medium-impact job from four to six threads, and a high-impact job a dozen or more. When this worker limit is reached (or before, if client load triggers impact management thresholds first), worker threads are throttled back or terminated.
For example, a node has four active threads, and the coordinator instructs it to cut back to three. The fourth thread is allowed to finish the individual work item it is currently processing, but then quietly exit, even though the task as a whole might not be finished. A restart checkpoint is taken for the exiting worker thread’s remaining work, and this task is returned to a pool of tasks requiring completion. This unassigned task is then allocated to the next worker thread that requests a work assignment, and processing continues from the restart check-point. This same mechanism applies in the event that multiple jobs are running simultaneously on a cluster.
In situations where the job engine sees the available capacity on one or more disk pools fall below a low space threshold, it engages low space mode. This enables space-saving jobs to run and reclaim space before the job engine or even the cluster become unusable. When the job engine is in low-space mode new jobs will not be started, and any jobs that are not space-saving will be paused. Once free space returns above the low-space threshold, jobs that have been paused for space are resumed.
The space-saving jobs are:
- AutoBalance(LIN)
- Collect
- MultiScan
- ShadowStoreDelete
- SnapshotDelete
- TreeDelete
Once the cluster is no longer space constrained, any paused jobs are automatically resumed.
Not all OneFS Job Engine jobs run equally fast. For example, a job which is based on a file system tree walk will run slower on a cluster with a very large number of small files than on a cluster with a low number of large files. Jobs which compare data across nodes, such as Dedupe, will run more slowly where there are many more comparisons to be made. Many factors play into this, and true linear scaling is not always possible. If a job is running slowly the first step is to discover what the specific context of the job is.
There are three main methods for jobs, and their associated processes, to interact with the file system:
- Via metadata, using a LIN scan. An example of this is IntegrityScan, when performing an on-line file system verification.
- Traversing the directory structure directly via a tree walk. For example, QuotaScan, when performing quota domain accounting.
- Directly accessing the underlying cylinder groups and disk blocks, via a linear drive scan. For example, MediaScan, when looking for bad disk sectors.
Each of these approaches has its pros and cons and will suit particular jobs. The specific access method influences the run time of a job. For instance, some jobs are unaffected by cluster size, others slow down or accelerate with the more nodes a cluster has, and some are highly influenced by file counts and directory depths.
For a number of jobs, particularly the LIN-based ones, the job engine will provide an estimated percentage completion of the job during runtime.
With LIN scans, even though the metadata is of variable size, the job engine can fairly accurately predict how much effort will be required to scan all LINs. The data, however, can be of widely-variable size, and so estimates of how long it will take to process each task will be a best reasonable guess.
For example, the job engine might know that the highest LIN is 1:0009:0000. Assuming the job will start with a single thread on each of three nodes, the coordinator evenly divides the LINs into nine ranges: 1:0000:0000-1:0000:ffff, 1:0001:0000-1:0001:ffff, etc., through 1:0008:0000-1:0009:0000. These nine tasks would then be divided between the three nodes. However, there is no guaranty that each range will take the same time to process. For example, the first range may have fewer actual LINs, as a result of old LINs having been deleted, so complete unexpectedly fast. Perhaps the third range contains a disproportional number of large files and so takes longer to process. And maybe the seventh range has heavy contention with client activity, also resulting in an increased execution time. Despite such variances, the splitting and redistribution of tasks across the node manager processes alleviates this issue, mitigating the need for perfectly-fair divisions at the onset.
Priorities play a large role in job initiation and it is possible for a high priority job to significantly impact the running of other jobs. This is by design, since FlexProtect should be able to run with a greater level of urgency than SmartPools, for example. However, sometimes this can be an inconvenience, which is why the storage administrator has the ability to manually control the impact level and relative priority of jobs.
Certain jobs like FlexProtect have a corresponding job provided with a name suffixed by ‘Lin’, for example FlexProtectLin. This indicates that the job will automatically, where available, use an SSD-based copy of metadata to scan the LIN tree, rather than the drives themselves. Depending on the workflow, this will often significantly improve job runtime performance.
On large clusters with multiple jobs running at high impact, the job coordinator can become bombarded by the volume of task results being sent directly from the worker threads. This is mitigated by certain jobs performing intermediate merging of results on individual nodes and batching delivery of their results to the coordinator. The jobs that support results merging include:
| · AutoBalance(Lin) | · MultiScan |
| · AVScan | · PermissionRepair |
| · CloudPoolsLin | · QuotaScan |
| · CloudPoolsTreewalk | · SnapRevert |
| · Collect | · SnapshotDelete |
| · FlexProtect(Lin) | · TreeDelete |
| · LinCount | · Upgrade |