As clusters increase in scale and the number of competing workloads place demands on system resources, more visibility is required in order to share cluster resources equitably. OneFS partitioned performance monitoring helps define, monitor and react to performance-related issues on the cluster. This allows storage admins to pinpoint resource consumers, helping to identify rogue workloads, noisy neighbor processes, or users that consume excessive system resources.
Partitioned performance monitoring can be used to define workloads and view the associated performance statistics – protocols, disk ops, read/write bandwidth, CPU, IOPs, etc. Workload definitions can be quickly and simply configured to include any combination of directories, exports, shares, paths, users, clients and multi-tenant access zones. Customized settings and filters can be crafted to match specific workloads for a dataset that meets the required criteria, and reported statistics are refreshed every 30 seconds. Workload monitoring is also key for show-back and charge-back resource accounting.
| Category | Description | Example |
| Workload | A set of identification metrics and resource consumption metrics. | {username:nick, zone_name:System} consumed {cpu:1.2s, bytes_in:10K, bytes_out:20M, …} |
| Dataset | A specification of identification metrics to aggregate workloads by, and the workloads collected that match that specification. | {username, zone_name} |
| Filter | A method for including only workloads that match specific identification metrics. | {zone_name:System} |
Each resource listed below is tracked by certain stages of partitioned performance monitoring to provide statistics within a performance dataset, and for limiting specific workloads.
| Resource Name | Definition | First Introduced |
| CPU Time | Measures CPU utilization. There are two different measures of this at the moment; raw measurements are taken in CPU cycles, but they are normalized to microseconds before aggregation. | OneFS 8.0.1 |
| Reads | A count of blocks read from disk (including SSD). It generally counts 8 KB file blocks, though 512-byte inodes also count as a full block. These are physical blocks, not logical blocks, which doesn’t matter much for reads, but is important when analyzing writes. | OneFS 8.0.1 |
| Writes | A count of blocks written to disk; or more precisely, to the journal. As with reads, 512-byte inode writes are counted as full blocks; for files, 8 KB blocks. Since these are physical blocks, writing to a protected file will count both the logical file data and the protection data. | OneFS 8.0.1 |
| L2 Hits | A count of blocks found in a node’s L2 (Backend RAM) cache on a read attempt, avoiding a read from disk. | OneFS 8.0.1 |
| L3 Hits | A count of blocks found in a node’s L3 (Backend SSD) cache on a read attempt, replacing a read from disk with a read from SSD. | OneFS 8.0.1 |
| Protocol Operations | · Protocol (smb1,smb2,nfs3, nfs4, s3)
· NFS in OneFS 8.2.2 and later · SMB in OneFS 8.2 and later · S3 in OneFS 9.0 · For SMB 1, this is the number of ops (commands) on the wire with the exception of the NEGOTIATE op. · For SMB 2/3 this is the number of chained ops (commands) on the wire, with the exception of the NEGOTIATE op. · The counted op for chained ops will always be the first op. · SMB NEGOTIATE ops will not be associated with a specific user. |
OneFS 8.2.2 |
| Bytes In | A count of the amount of data received by the server from a client, including the application layer headers but not including TCP/IP headers. | OneFS 8.2 |
| Bytes Out | A count of the amount of data sent by the server to a client, including the application layer headers but not including TCP/IP headers. | OneFS 8.2 |
| Read/Write/Other Latency Total | Sum of times taken from start to finish of ops as they run through the system identical to that provided by isi statistics protocol. Specifically, this is the time in between LwSchedWorkCreate and the final LwSchedWorkExecuteStop for the work item. Latencies are split between the three operations types, read/write/other, with a separate resource for each.
Use Read/Write/Other Latency Count to calculate averages |
OneFS 8.2 |
| Read/Write/Other Latency Count | Count of times taken from start to finish of ops as they run through the system identical to that provided by isi statistics protocol. Latencies are split between the three operations types, read/write/other, with a separate resource for each.
Used to calculate the average of Read/Write/Other Latency Total |
OneFS 8.2 |
| Workload Type | · Dynamic (or blank) – Top-N tracked workload
· Pinned – Pinned workload · Overaccounted – The sum of all stats that have been counted twice within the same dataset, used so that a workload usage % can be calculated. · Excluded – The sum of all stats that do not match the current dataset configuration. This is for workloads that do not have an element specified that is defined in the category, or for workloads in filtered datasets that do not match the filter conditions. · Additional – The amount of resources consumed by identifiable workloads not matching any of the above. Principally any workload that has dropped off of the top-n. · System – The amount of resources consumed by the kernel. · Unknown – The amount of resources that we could not attribute to any workload, principally due to falling off of kernel hashes of limited size. |
OneFS 8.2 |
Identification Metrics are the client attributes of a workload interacting with OneFS through Protocol Operations, or System Jobs or Services. They are used to separate each workload into administrator-defined datasets.
| Metric Name | Definition | First Introduced |
| System Name | The system name of a given workload. For services started by isi_mcp/lwsm/isi_daemon this is the service name itself. For protocols this is inherited from the service name. For jobs this is the job id in the form “Job: 123”. | OneFS 8.0.1 |
| Job Type + Phase | A short containing the job type as the first n bytes, and the phase as the rest of the bytes. There are translations for job type to name, but not job phase to name. | OneFS 8.0.1 |
| Username | The user as reported by the native token. Translated back to username if possible by IIQ / stat summary view. | OneFS 8.2 |
| Local IP | IP Address, CIDR Subnet or IP Address range of the node serving that workload. CIDR subnet or range will only be output if a pinned workload is configured with that range. There is no overlap between addresses/subnets/ranges for workloads with all other metrics matching. | OneFS 8.2 |
| Remote IP | IP Address, CIDR Subnet or IP Address range of the client causing this workload. CIDR subnet or range will only be output if a pinned workload is configured with that range. There is no overlap between addresses/subnets/ranges for workloads with all other metrics matching. | OneFS 8.2 |
| Protocol | Protocol enumeration index. Translated to string by stat.
· smb1, smb2 · nfs3, nfs4 · s3 |
OneFS 8.2, OneFS 8.2.2, & OneFS 9.0 |
| Multi-tenant access zone | The zone id of the current workload. If zone id is present all username lookups etc should use that multi-tenant access zone, otherwise it should use the default “System” multi-tenant access zone. Translation to string performed by InsightIQ / summary view. | OneFS 8.0.1 |
| Group | The group that the current workload belongs to. Translated to string name by InsightIQ / summary view. For any dataset with group defined as an element the primary group will be tracked as a dynamic workload (unless there is a matching pinned workload in which case that will be used instead). If there is a pinned workload/filter with a group specified, the additional groups will also be scanned and tracked. If multiple groups match then stats will be double accounted, and any double accounting will be summed in the “Overaccounted” workload within the category. | OneFS 8.2 |
| IFS Domain | The partitioned performance IFS domain and respective path LIN that a particular file belongs to, determined using the inode. Domains are not tracked using dynamic workloads unless a filter is created with the specified domain. Domains are created/deleted automatically by configuring a pinned workload or specifying a domain in a filter. A file can belong to multiple domains in which case there will be double accounting within the category. As with groups any double accounting will be summed in the “Overaccounted” workload within the category. The path must be resolved from the LIN by InsightIQ or the Summary View. | OneFS 8.2 |
| SMB Share Name | The name of the SMB share that the workload is accessing through, provided by the smb protocol. Also provided at the time of actor loading are the Session ID and Tree ID to improve hashing/dtoken lookup performance within the kernel. | OneFS 8.2 |
| NFS Export ID | The ID of the NFS export that the workload is accessing through, provided by the smb protocol. | OneFS 8.2.2 |
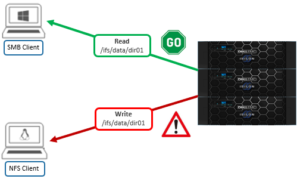
| Path | Track and report SMB traffic on a specified /ifs directory path. Note that NFS traffic under a monitored path is excluded | OneFS 8.2.2 |
So how does this work in practice? From the CLI, the following command syntax can be used to create a standard performance dataset monitor:
# isi performance dataset create –-name <name> <metrics>
For example:
# isi performance dataset create --name my_dataset username zone_name
To create a dataset that requires filters, use:
# isi performance dataset create –-name <name> <metrics> –-filters <filter-metrics>

# isi performance dataset create --name my_filtered_dataset username zone_name --filters zone_name
For example, to monitor the NFS exports in multi-tenant access zones:
# isi performance datasets create --name=dataset01 export_id zone_name

# isi statistics workload list --dataset=dataset01
Or to monitor by username for NFSv3 traffic only
# isi performance datasets create --name=ds02 username protocol --filters=protocol

# isi performance filters apply ds02 protocol:nfs3

# isi statistics workload list --dataset=ds02
Other performance dataset operation commands include:
# isi performance dataset list

# isi performance dataset view <name|id>

# isi performance dataset modify <name|id> --name <new_name>

# isi performance dataset delete <name|id>
A dataset will display the top 1024 workloads by default. Any remainder will be aggregated into a single additional workload.
If you want a workload to always be visible, it can be pinned using the following syntax:
# isi performance workload pin <dataset_name|id> <metric>:<value>
For example:
# isi performance workload pin my_dataset username:nick zone_name:System
Other workload operation commands include:
# isi performance workload list <dataset_name|id>

# isi performance workload view <dataset_name|id> <workload_name|id>

# isi performance workload modify <dataset_name|id> <workload_name|id> --name <new_name>

# isi performance workload unpin <dataset_name|id> <workload_name|id>
Multiple filters can also be applied to the same dataset. A workload will be included if it matches any of the filters. Any workload that doesn’t match a filter be aggregated into an excluded workload.
The following CLI command syntax can be sued to apply a filter:
# isi performance filter apply <dataset_name|id> <metric>:<value>
For example:
# isi performance filter apply my_filtered_dataset zone_name:System
Other filter options include:
# isi performance filter list <dataset_name|id>

# isi performance filter view <dataset_name|id> <filter_name|id>

# isi performance filter modify <dataset_name|id> <filter_name|id> --name <new_name>

# isi performance filter remove <dataset_name|id> <filter_name|id>
The following syntax can be used to enable path tracking. For example, to monitor traffic under /ifs/data:
# isi performance datasets create –name=dataset1 path

# isi performance workloads pin dataset1 path:/ifs/data/
Be aware that NFS traffic under a monitored path is currently not reported. For example:
The following CLI command can be used to define and view statistics for a dataset:
# isi statistics workload –-dataset <dataset_name|id>
For example:
# isi statistics workload --dataset my_dataset

    CPU  BytesIn  BytesOut   Ops  Reads  Writes   L2   L3  ReadLatency  WriteLatency  OtherLatency  UserName   ZoneName  WorkloadType

-------------------------------------------------------------------------------------------------------------------------------------

 11.0ms     2.8M     887.4   5.5    0.0   393.7  0.3  0.0      503.0us       638.8us         7.4ms       nick     System             -

  1.2ms    10.0K     20.0M  56.0   40.0     0.0  0.0  0.0        0.0us         0.0us         0.0us      mary     System        Pinned

 31.4us     15.1      11.7   0.1    0.0     0.0  0.0  0.0      349.3us         0.0us         0.0us       nick Quarantine             -

166.3ms      0.0       0.0   0.0    0.0     0.1  0.0  0.0        0.0us         0.0us         0.0us         -          -      Excluded

 31.6ms      0.0       0.0   0.0    0.0     0.0  0.0  0.0        0.0us         0.0us         0.0us         -          -        System

 70.2us      0.0       0.0   0.0    0.0     3.3  0.1  0.0        0.0us         0.0us         0.0us         -          -       Unknown

  0.0us      0.0       0.0   0.0    0.0     0.0  0.0  0.0        0.0us         0.0us         0.0us         -          -    Additional

  0.0us      0.0       0.0   0.0    0.0     0.0  0.0  0.0        0.0us         0.0us         0.0us         -          - Overaccounted

-------------------------------------------------------------------------------------------------------------------------------------

Total: 8

Includes standard statistics flags, i.e. --numeric, --sort, --totalby etc..
Other useful commands include the following:
To list all available identification metrics:
# isi performance metrics list

# isi performance metrics view <metric>
To view/modify the quantity of top workloads collected per dataset:
# isi performance settings view

# isi performance settings modify <n_top_workloads>
To assist with troubleshooting, the validation of the configuration is thorough, and errors are output directly to the CLI. Name lookup failures, for example UID to username mappings, are reported in an additional column in the statistics output. Errors in the kernel are output to /var/log/messages and protocol errors are written to the respective protocol log.
Note that statistics are updated every 30 seconds and, as such, a newly created dataset will not show up in the statistics output until the update has occurred. Similarly, an old dataset may be displayed until the next update occurs.
A dataset with a filtered metric specified but with no filters applied will not output any workloads. Paths and Non-Primary groups are only reported if they are pinned or have a filter applied. Paths and Non-Primary groups may result in work being accounted twice within the same dataset, as they can match multiple workloads. The total amount over-accounted within a dataset is aggregated into the Overaccounted workload.
As mentioned previously, the NFS, SMB, and S3 protocols are now supported in OneFS 9.0. Other primary protocol monitoring support, such as HDFS, will be added in a future release.
In addition to protocol stats, OneFS also includes job performance resource monitoring, which provides statistics for the resources used by jobs – both cluster-wide and per-node. Available in a ‘top’ format, this command displays the top jobs and processes, and periodically updates the information.
For example, the following syntax shows, and indefinitely refreshes, the top five processes on a cluster:
# isi statistics workload --limit 5 –-format=top

last update:  2020-07-11T06:45:25 (s)ort: default

CPU   Reads Writes      L2    L3    Node  SystemName        JobType

1.4s  9.1k  0.0         3.5k  497.0 2     Job:  237         IntegrityScan[0]

1.2s  85.7  714.7       4.9k  0.0   1     Job:  238         Dedupe[0]

1.2s  9.5k  0.0         3.5k  48.5  1     Job:  237         IntegrityScan[0]

1.2s  7.4k  541.3       4.9k  0.0   3     Job:  238         Dedupe[0]

1.1s  7.9k  0.0         3.5k  41.6  2     Job:  237         IntegrityScan[0]
The resource statistics tracked per job, per job phase, and per node include CPU, reads, writes, and L2 & L3 cache hits. Unlike the output from the ‘top’ command, this makes it easier to diagnose individual job resource issues, etc.