As we saw in the first article in this series, InsightIQ (IIQ) Partitioned Performance Reporting provides rich, long‑term visibility into activity at both the dataset and workload levels.
This enhanced visualization and historical context enables cluster admins to quickly identify which workloads consumed the most resources within a selected timeframe, whether measured by average utilization, peak consumption, or sustained high‑usage patterns from pinned workloads.
Within the OneFS and InsightIQ lexicon, a Partitioned Performance dataset is a formally defined set of performance criteria. This can be a specific directory path, share or export, user or group, client address, or access zone, for which OneFS continuously records detailed metrics (including protocol operations, bandwidth, disk activity, and CPU utilization). Whereas a Partitioned Performance workload is the resulting stream of I/O activity that matches one or more of these datasets, whose time‑series statistics InsightIQ ingests, aggregates, and presents as a distinct workload in its performance reports.
So how does Partitioned Performance Reporting actually work?
Here’s the general flow:

The base prerequisites for configuring and running Partitioned Performance Reporting are a PowerScale cluster, ideally running OneFS 9.5 or later, plus an InsightIQ instance running version 5.0 or later. The current IIQ version is 6.2, and is available in two deployment models.
| Attribute | InsightIQ 6.2 Simple | InsightIQ 6.2 Scale |
| Scalability | Up to 10 clusters or 252 nodes | Up to 20 clusters or 504 nodes |
| Deployment | On VMware, using OVA template | RHEL, SLES, or Ubuntu with deployment script |
| Hardware requirements | VMware v15 or higher:
· CPU: 8 vCPU · Memory: 16GB · Storage: 1.5TB (thin provisioned); Or 500GB on NFS server datastore |
Up to 10 clusters and 252 nodes:
· CPU: 8 vCPU or Cores · Memory: 16GB · Storage: 500GB Up to 20 clusters and 504 nodes: · CPU: 12 vCPU or Cores · Memory: 32GB · Storage: 1TB |
| Networking requirements | 1 static IP on the PowerScale cluster’s subnet | 1 static IP on the PowerScale cluster’s subnet |
The InsightIQ v6.2 ecosystem encompases VMware ESXi v9.0.1 and v8 OU3, Ubuntu 24.04 Online deployment and OpenStack RHOSP 21 with RHEL 9.6, SLES 15 SP4, and Red Hat Enterprise Linux (RHEL) versions 9.6 and 8.10.
| Qualified on | InsightIQ 6.1 | InsightIQ 6.2 |
| OS (IIQ Scale Deployment) | RHEL 8.10, RHEL 9.6, and SLES 15 SP4 | RHEL 8.10, RHEL 9.6, and SLES 15 SP4 |
| PowerScale | OneFS 9.5 or later | OneFS 9.5 or later |
| VMware ESXi | ESXi v8.0U3 | ESXi v8.0U3, and ESXi v9.0.1 |
| VMware Workstation | Workstation 17 Free Version | Workstation 17 Free Version |
| Ubuntu | Ubuntu 24.04 Online deployment | Ubuntu 24.04 Online deployment |
| OpenStack | RHOSP 21 with RHEL 9.6 | RHOSP 21 with RHEL 9.6 |
Similarly, in addition to deployment on VMware ESXi 8 and 9, the InsightIQ Simple version can also be installed for free on VMware Workstation 17, providing the ability to stand up InsightIQ in a non-production or lab environment for trial or demo purposes, without incurring a VMware licensing charge.
InsightIQ uses the OneFS platform API in conjunction with an authenticated service account (typically the ‘insightiq’ user) to query cluster metrics and metadata on a schedule. It collects performance and health telemetry—cluster and node CPU, disk and protocol stats, client/workload metrics (via Partitioned Performance), plus capacity and configuration data—at different native sample lengths (for example ~30 seconds for CPU, up to ~5 minutes for capacity).
For Partitioned Performance, InsightIQ uses PP API endpoints to discover datasets (paths, users, clients, zones, etc.) and then polls their 30‑second statistics, ingesting them into its time‑series store and aggregating them into minute/hour/day buckets for reporting. File system analytics:
For File System Analytics, OneFS runs the FSAnalyze job on the cluster; that job writes an analytics dataset which InsightIQ then imports, rather than reading /ifs directly in real time.
InsightIQ’s collection engine writes the raw samples into its database, then its WebUI renders charts, tables, and reports (performance, health, capacity, partitioned performance, FSA) from those stored samples.
The specific process for configuring and viewing cluster performance reports via an InsightIQ monitoring instance are as follows:
- Enable the InsightIQ service account on the cluster

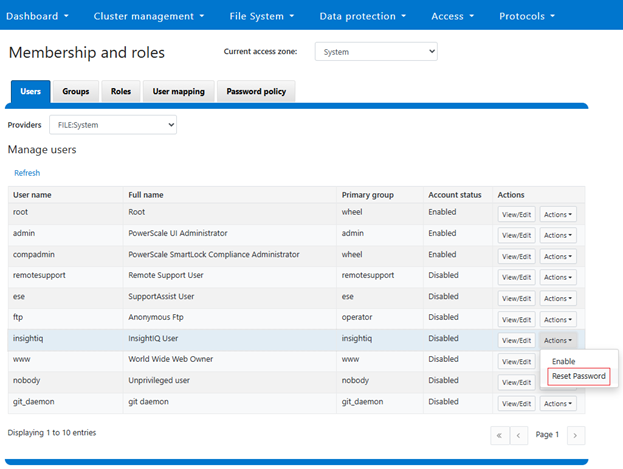
First, prepare the PowerScale cluster to be monitored by enabling the InsightIQ service account. This can be performed from the OneFS WebUI under Access > Membership and roles > Users. Select ‘FILE:System’ under the ‘Providers’ drop down list, and click ‘Reset Password’ under the ‘Actions’ option for the ‘insightiq’ user account:
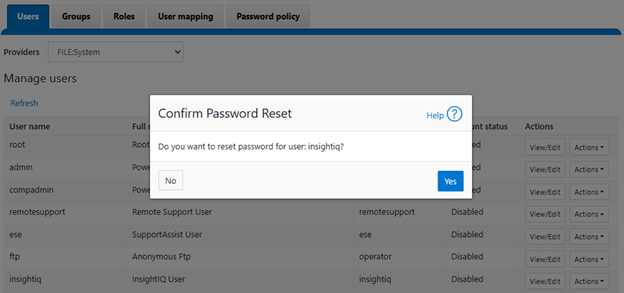
Confirm at the popup prompt:
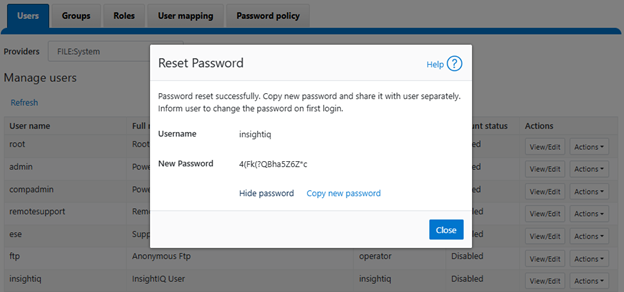
View and record the new password, which will be required when adding the cluster to InsightIQ:
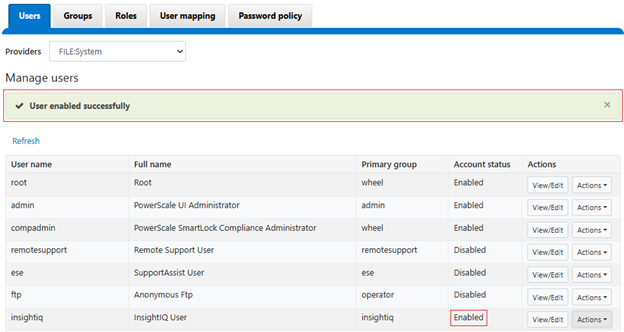
Next, click ‘Enable’ under the ‘insightiq’ user ‘Actions’ drop down menu. For example:
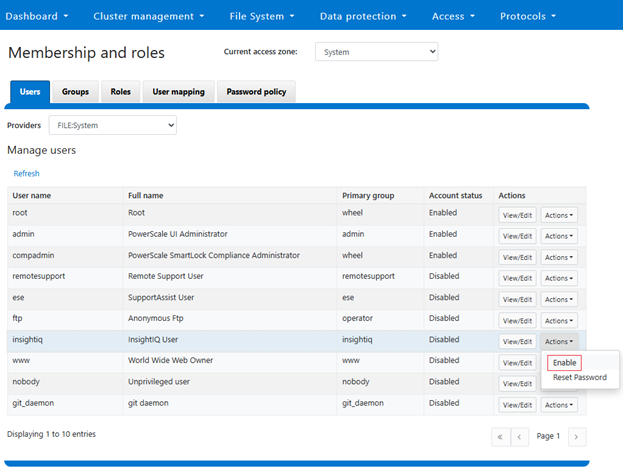
When successfully activated, a confirmation banner will be displayed and the ‘insightiq’ user account marked as ‘Enabled’:
If the password reset step is missed, the following warning will be displayed when attempting to enable the ‘insightiq’ users:
![]()
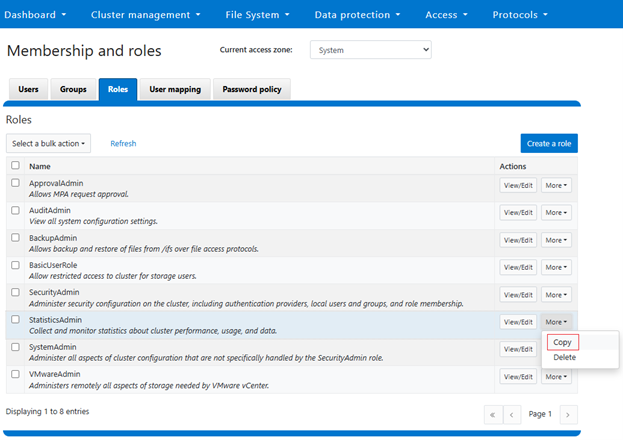
- Create an InsightIQ RBAC role

Next, navigate to the ‘Roles’ tab and clone an ‘InsightIQ’ from the default ‘StatisticsAdmin’ role by clicking on copy:
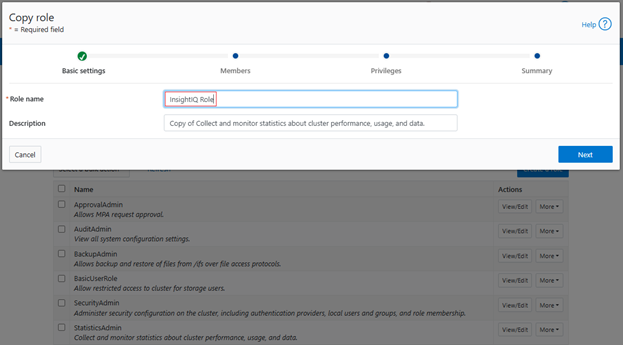
Next, add the role name:
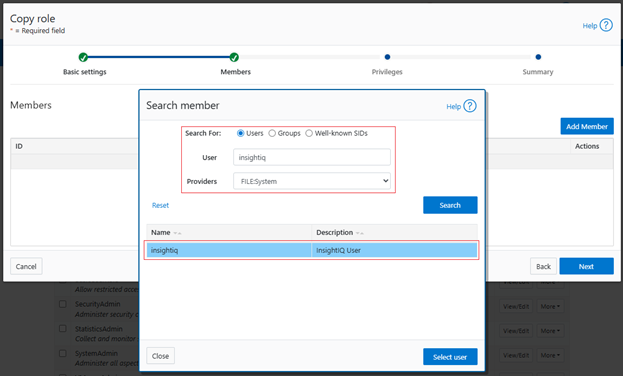
Next, search for the ‘insightiq’ user account from the ‘FILE:System’ provider, and click ‘Select user’:
Note that InsightIQ 5.0 and above has the ability to generate a Partition Performance Report for monitored clusters. To view this report for the PowerScale cluster being monitored requires the ‘ISI_PRIV_PERFORMANCE’ privilege with read permissions.
This can be done by scrolling down to the Performance section and clicking ‘R’ to enable read permissions:
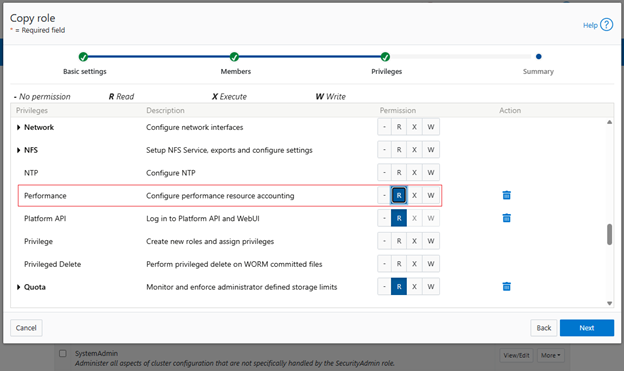
Click ‘Next’, review the role and user configuration and click ‘Submit’:
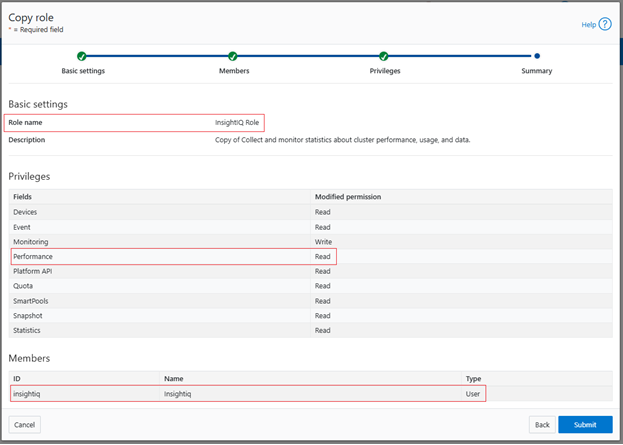
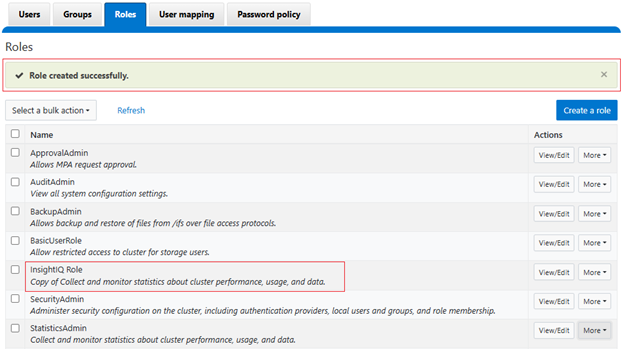
A success banner and the new InsightIQ role are displayed:
- Add the cluster to InsightIQ

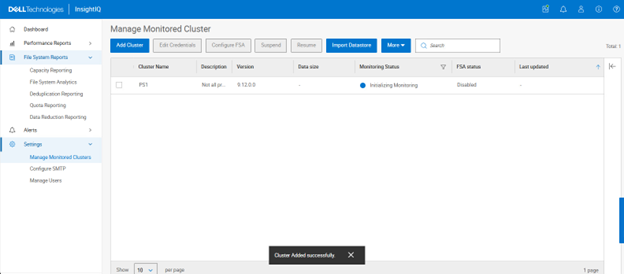
Next login in to the InsightIQ WebUI as ‘Administrator’. Add cluster under settings:
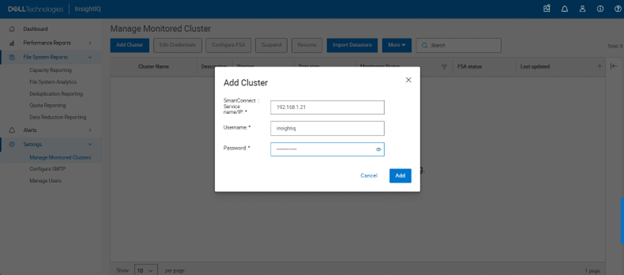
Initiating monitoring…
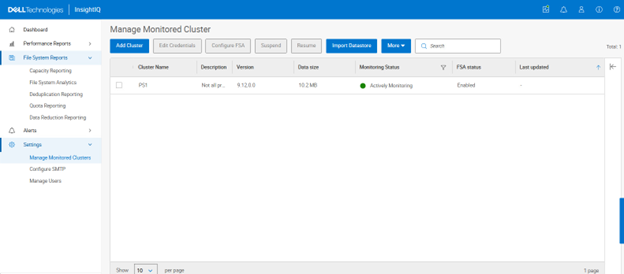
- Verify cluster monitoring is active

The green icon adjacent to the pertinent cluster indicates that initialization is complete and monitoring is now active:
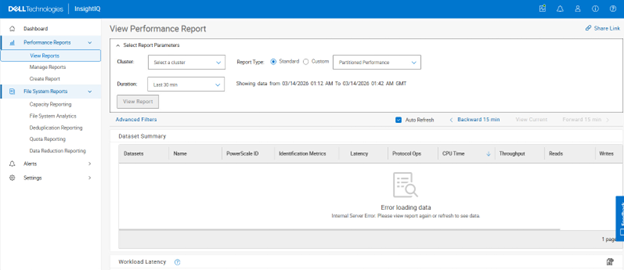
- Select and View Performance Reports:

Navigating to Performance Reports > View Reports allows the desired cluster(s) to be selected:
The Performance Report types that can be selected include:
- Cluster Performance
- Node Performance
- Network Performance
- Client Performance
- Disk Performance
- File System Performance
- File System Cache Performance
- Cluster Capacity
- Deduplication
- Cluster Events
- Partitioned Performance
For example:
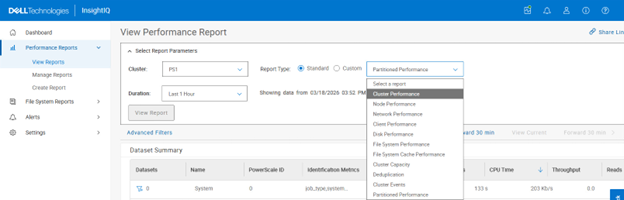
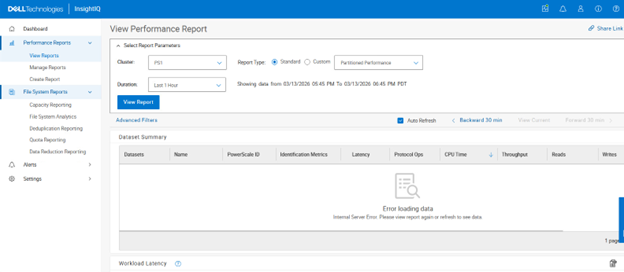
In the following example, a partitioned performance report is selected for cluster ‘PS1’ with a duration window spanning the previous hour:
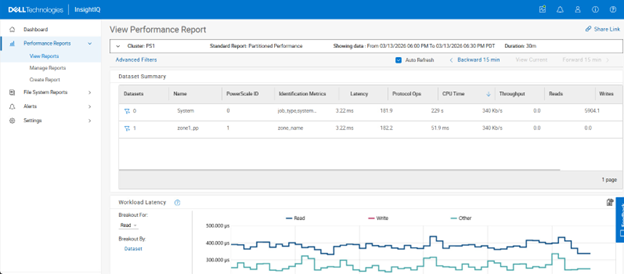
Clicking on ‘View Report’ shows both the default ‘system’ multi-tenant access zone plus any other custom multi-tenant access zones – in this case ‘zone1_pp’:
Selecting the funnel icon next to the dataset of choice allows filtering rules to be easily crafted:
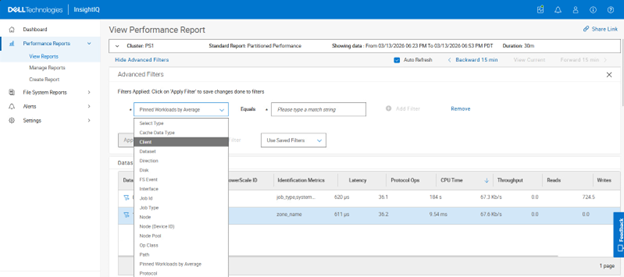
Filtering criteria include:
| Partitioned Performance Report Filters | Options |
| Cache data type | User data; Metadata |
| Dataset | <name> |
| Direction | In; Out |
| Disk | <node>/Bay<num> |
| FS event | Blocked; Contended; Deadlocked; Getattr; Link; Lock; Lookup; Read; Rename; Setattr; Unlink; Write |
| Interface | <node>/ext-<interface> |
| Job ID | <number> |
| Job type | AVScan; AutoBalance; ChangelistCreate; Collect; ComplianecStoreDelete; Dedupe; DedupeAssessent; DomainMark; DomainTag; EsrsMftDownload; FSAnalyze; FilePolicy; Flexprotect; IndexUpdate; IntegrityScan, LinCount; MediaScan; MultiScan; PermissionRepair; QuotaScan; SetProtectPlus; ShadowStoreDelete; ShadowStoreProtect; SmartPools; SmartPoolsTree; SnapRevert; SnapshotDelete; TreeDelete; WormQueue |
| Node | <node_ID> |
| Node (device ID) | <device_ID> |
| Node pool | <node_pool_name> |
| Op class | Create; Delete; File_state; Namespace_read; Namespace_write; Other; Read; Session_state; Unimplemented; Write |
| Path | <path_name> |
| Pinned workloads by average | <value> |
| Protocol | FTP; HDFS; HTTP; NFS; NFS3; NFS4; NFS4RDMA; NFSRDMA; NLM; pAPI; S3; SIQ; SMB; SMB1; SMB2 |
| Service | <name> |
| Tier | <name> |
| Workloads by average | <value> |
| Workloads by max values | <value> |
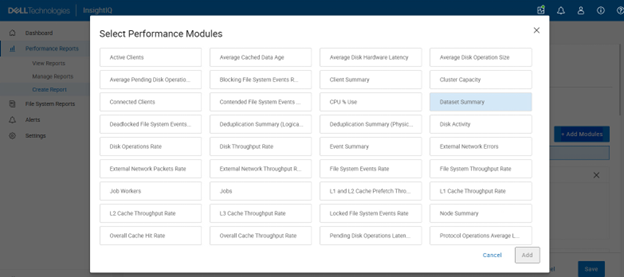
In addition to the standard reports, custom reports can also be crafted:

A range of performance modules can be selected for custom reports, including:
- Active clients
- Average cached data age
- Average disk hardware latency
- Average disk operation size
- Average pending disk operations
- Connected clients
- Contended file system events
- CPU % use
- Dataset summary
- Deadlocked file system events
- Deduplication summary (logical)
- Deduplication summary (physical)
- Disk activity
- Disk operations rate
- Disk throughput rate
- Event summary
- External network errors
- External network packets rate
- External network throughput rate
- File system events rate
- File system throughput rate
- Job workers
- Jobs
- L1 and L2 cache prefetch throughput
- L1 cache throughput rate
- L2 cache throughput rate
- L3 cache throughput rate
- Locked file system events rate
- Node summary
- Overall cache hit rate
- Overall cache throughput rate
- Pending disk operation latency
- Protocol operations average latency
- Protocol operations rate
- Slow disk access rate
- Workload CPU time
- Workload IOPS
- Workload L2/L3 cache hits
- Workload latency
- Workload throughput
For example:
Custom reports can have a schedule added:
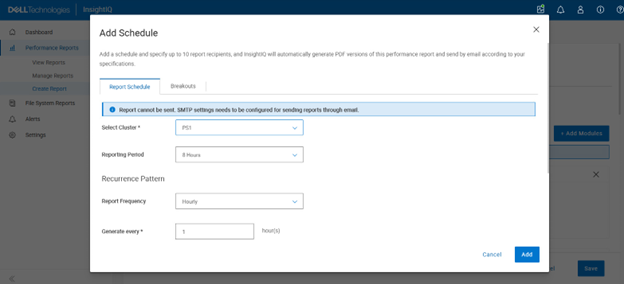
Plus, up to ten report recipients can also be specified, and InsightIQ will automatically generate PDF versions of the performance report and distribute them via email.
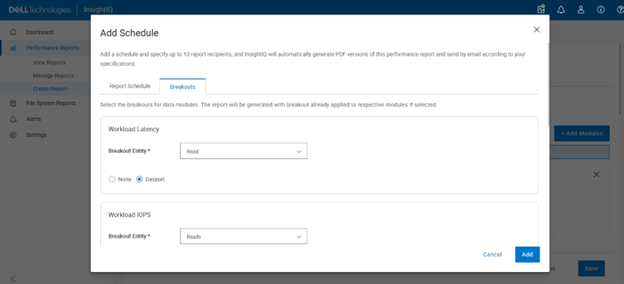
Breakouts can also be selected for a report’s data modules, and the report will be generated with breakouts already applied to their respective modules:
The flexible visualization options of InsightIQ partitioned performance monitoring —combined with historical context—allows cluster administrators to quickly determine which workloads consumed the greatest share of resources during any selected timeframe. Usage can be evaluated by average utilization, peak demand, or sustained high‑usage patterns from pinned workloads. These PP reports also function as an effective diagnostic resource, enabling Dell Support to investigate, triage, and resolve customer performance concerns more efficiently.
As clusters grow and more simultaneous workloads compete for shared resources, ensuring fair resource allocation becomes increasingly complex. Partitioned Performance monitoring helps meet this challenge by allowing administrators to define, monitor, and respond to performance‑related conditions across the cluster. With this enhanced visibility, storage administrators can readily identify the dominant consumers of system resources, making it easier to spot rogue workloads, noisy‑neighbor processes that excessively use CPU, cache, or I/O bandwidth, or user activity that significantly affects overall cluster performance.