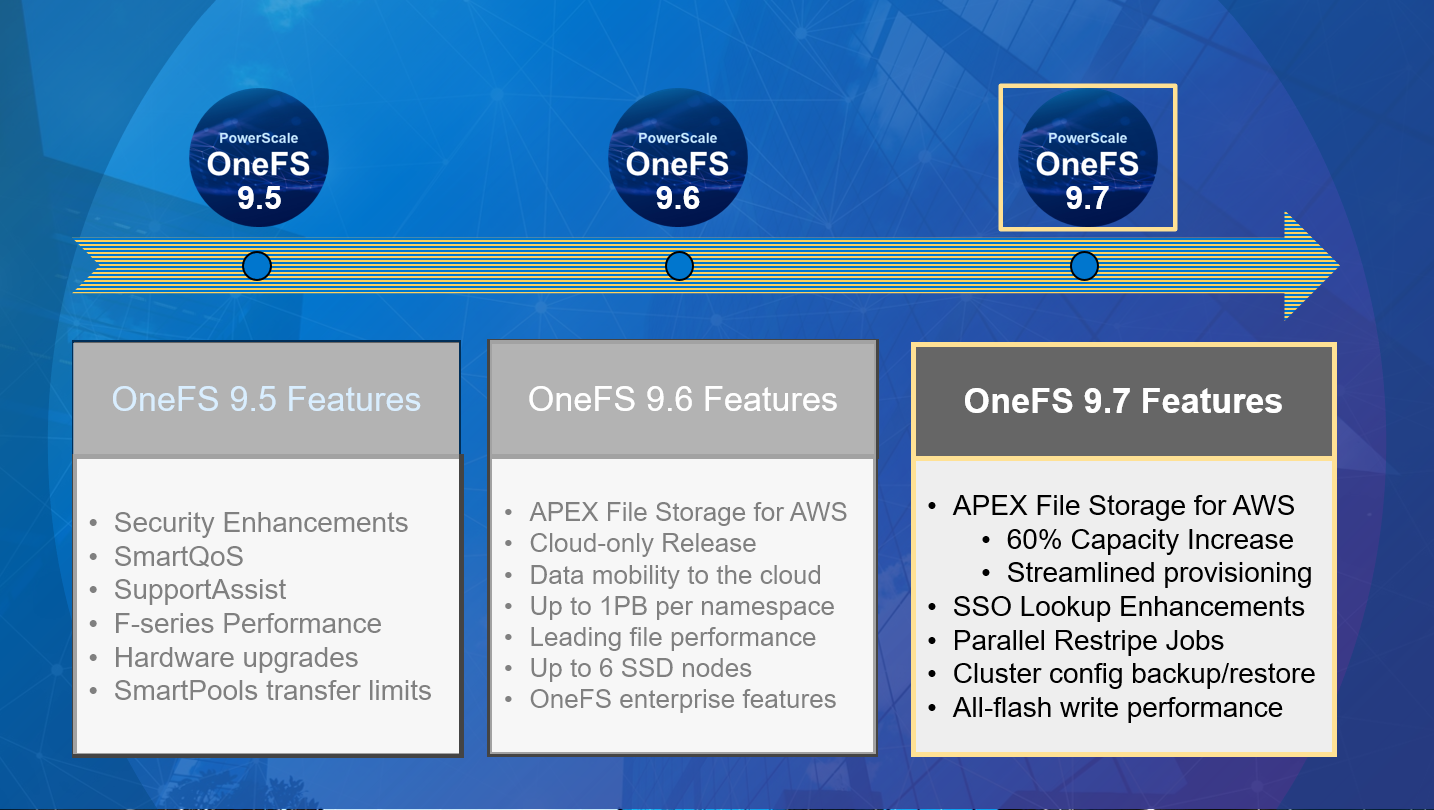
One of the cluster’s functional areas that sees feature enhancement love in the new OneFS 9.7 release is the Job Engine. Specifically, the ability to support multiple restriping jobs.
As you’re probably aware, the Job Engine is a OneFS service, or daemon, that runs cluster housekeeping jobs, storage services, plus a variety of user initiated data management tasks. As such, the Job Engine performs a diverse and not always complimentary set of roles. On one hand it attempts to keeps the cluster healthy and balanced, while mitigating performance impact, and still allowing customers to perform on-demand large parallel, cluster-wide deletes, full-tree permissions management, data tiering, etc.
At a high level, this new OneFS 9.7 parallel restriping feature enables the Job Engine to run multiple restriping jobs at the same time. Restriping in OneFS is the process whereby filesystem blocks are moved around for repair, balance, tiering, etc. These restriping jobs include FlexProtect, MediaScan, AutoBalance, MultiScan, SmartPools, etc.
As such, an example of parallel restring could be running SmartPools alongside MultiScan, helping to unblock a data tiering workflow which was stuck behind an important cluster maintenance job. The following OneFS 9.7 example shows the FlexProtectLin, MediaScan, and SmartPools restriping jobs running concurrently:
# isi job jobs list

ID   Type           State   Impact  Policy  Pri  Phase  Running Time

---------------------------------------------------------------------

2273 MediaScan      Running Low     LOW     8    1/8    7h 57m

2275 SmartPools     Running Low     LOW     6    1/2    9m 44s

2305 FlexProtectLin Running Medium  MEDIUM  1    1/4    10s

---------------------------------------------------------------------

Total: 3
By way of contrast, in releases prior to OneFS 9.7, only a single restriping job can run at any point in time. Any additional restriping jobs are automatically places in a ‘waiting state’. But before getting into the details of the parallel restriping feature, a quick review of the Job Engine, and its structure and function could be useful.
In OneFS, the Job Engine runs across the entire cluster and is responsible for dividing and conquering large storage management and protection tasks. To achieve this, it reduces a task into smaller work items and then allocates, or maps, these portions of the overall job to multiple worker threads on each node. Progress is tracked and reported on throughout job execution and a detailed report and status is presented upon completion or termination.
A comprehensive check-pointing system allows jobs to be paused and resumed, in addition to stopped and started. Additionally, the Job Engine also includes an adaptive impact management system, CPU and drive-sensitive impact control, and the ability to run up to three jobs at once.
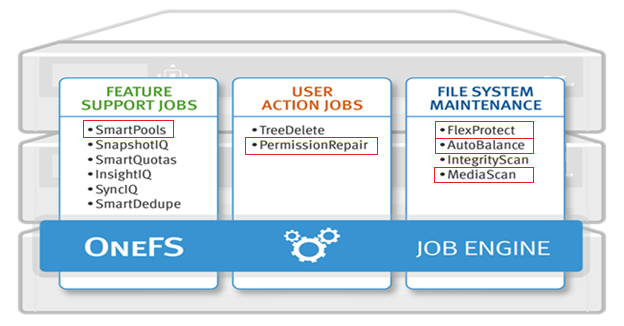
Jobs are executed as background tasks across the cluster, using spare or especially reserved capacity and resources, and can be categorized into three primary classes:
| Category | Description |
| File System Maintenance Jobs | These jobs perform background file system maintenance, and typically require access to all nodes. These jobs are required to run in default configurations, and often in degraded cluster conditions. Examples include file system protection and drive rebuilds. |
| Feature Support Jobs | The feature support jobs perform work that facilitates some extended storage management function, and typically only run when the feature has been configured. Examples include deduplication and anti-virus scanning. |
| User Action Jobs | These jobs are run directly by the storage administrator to accomplish some data management goal. Examples include parallel tree deletes and permissions maintenance. |
Although the file system maintenance jobs are run by default, either on a schedule or in reaction to a particular file system event, any Job Engine job can be managed by configuring both its priority-level (in relation to other jobs) and its impact policy.
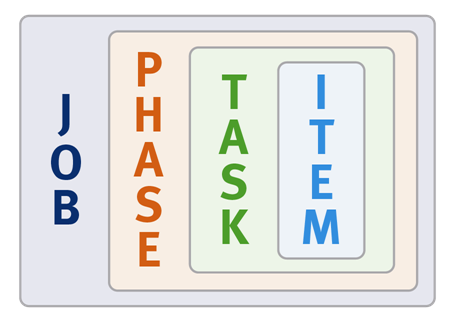
Job Engine jobs often comprise several phases, each of which are executed in a pre-defined sequence. For instance, jobs like TreeDelete comprise a single phase, whereas more complex jobs like FlexProtect and MediaScan that have multiple distinct phases.
A job phase must be completed in entirety before the job can progress to the next phase. If any errors occur during execution, the job is marked “failed” at the end of that particular phase and the job is terminated.
Each job phase is composed of a number of work chunks, or Tasks. Tasks, which are comprised of multiple individual work items, are divided up and load balanced across the nodes within the cluster. Successful execution of a work item produces an item result, which might contain a count of the number of retries required to repair a file, plus any errors that occurred during processing.
When a Job Engine job needs to work on a large portion of the file system, there are four main methods available to accomplish this. The most straightforward access method is via metadata, using a Logical Inode (LIN) Scan. In addition to being simple to access in parallel, LINs also provide a useful way of accurately determining the amount of work required.
A directory tree walk is the traditional access method since it works similarly to common UNIX utilities, such as find – albeit in a far more distributed way. For parallel execution, the various job tasks are each assigned a separate subdirectory tree. Unlike LIN scans, tree walks may prove to be heavily unbalanced, due to varying sub-directory depths and file counts.
Disk drives provide excellent linear read access, so a drive scan can deliver orders of magnitude better performance than a directory tree walk or LIN scan for jobs that don’t require insight into file system structure. As such, drive scans are ideal for jobs like MediaScan, which linearly traverses each node’s disks looking for bad disk sectors.
A fourth class of Job Engine jobs utilize a ‘changelist’, rather than LIN-based scanning. The changelist approach analyzes two snapshots to find the LINs which changed (delta) between the snapshots, and then dives in to determine the exact changes.
Architectural, the job engine is based on a delegation hierarchy comprising coordinator, director, manager, and worker processes.
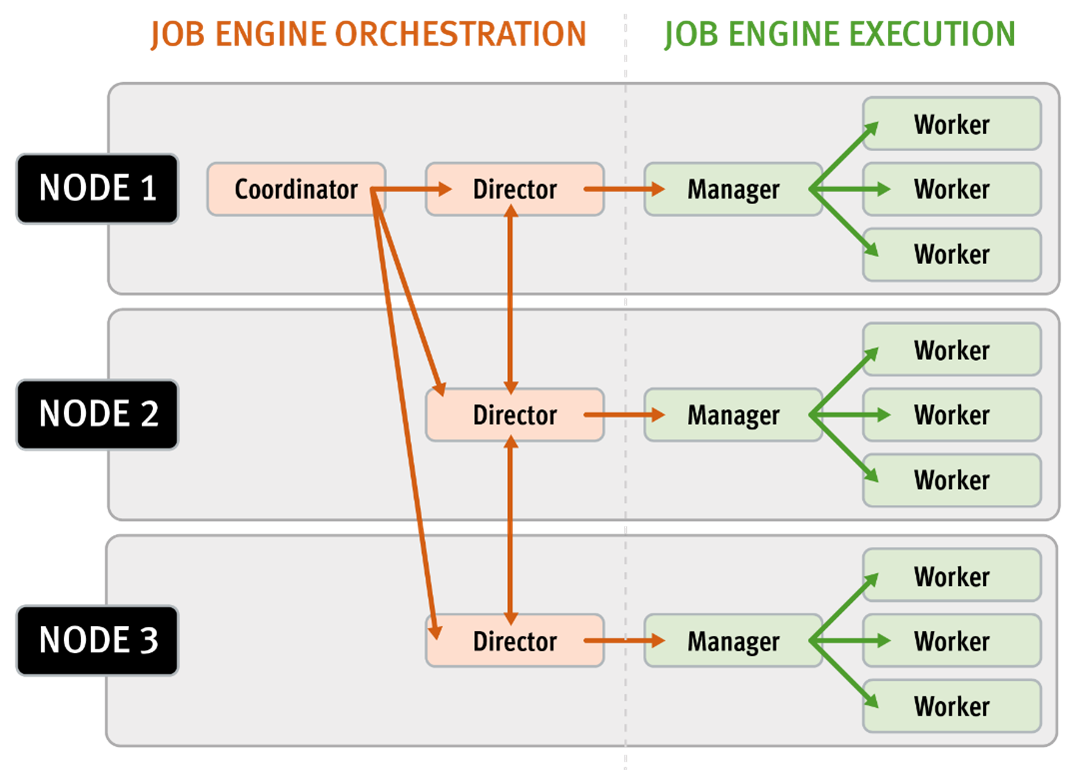
There are other threads which are not included in the diagram above, which relate to internal functions, such as communication between the various JE daemons, and collection of statistics. Also, with three jobs running simultaneously, each node would have three manager processes, each with its own number of worker threads.
Once the work is initially allocated, the job engine uses a shared work distribution model in order to execute the work, and each job is identified by a unique Job ID. When a job is launched, whether it’s scheduled, started manually, or responding to a cluster event, the Job Engine spawns a child process from the isi_job_d daemon running on each node. This job engine daemon is also known as the parent process.
The entire job engine’s orchestration is handled by the coordinator, which is a process that runs on one of the nodes in a cluster. Any node can act as the coordinator, and the principal responsibilities include:
- Monitoring workload and the constituent nodes’ status
- Controlling the number of worker threads per-node and cluster-wide
- Managing and enforcing job synchronization and checkpoints
While the actual work item allocation is managed by the individual nodes, the coordinator node takes control, divides up the job, and evenly distributes the resulting tasks across the nodes in the cluster. For example, if the coordinator needs to communicate with a manager process running on node five, it first sends a message to node five’s director, which then passes it on down to the appropriate manager process under its control. The coordinator also periodically sends messages, via the director processes, instructing the managers to increment or decrement the number of worker threads.
The coordinator is also responsible for starting and stopping jobs, and also for processing work results as they are returned during the execution of a job. Should the coordinator process die for any reason, the coordinator responsibility automatically moves to another node.
The coordinator node can be identified via the following CLI command:
# isi job status --verbose | grep Coordinator
Each node in the cluster has a job engine director process, which runs continuously and independently in the background. The director process is responsible for monitoring, governing and overseeing all job engine activity on a particular node, constantly waiting for instruction from the coordinator to start a new job. The director process serves as a central point of contact for all the manager processes running on a node, and as a liaison with the coordinator process across nodes. These responsibilities include:
- Manager process creation
- Delegating to and requesting work from other peers
- Sending and receiving status messages
The manager process is responsible for arranging the flow of tasks and task results throughout the duration of a job. The manager processes request and exchange work with each other and supervise the worker threads assigned to them. At any point in time, each node in a cluster can have up to three manager processes, one for each job currently running. These managers are responsible for overseeing the flow of tasks and task results.
Each manager controls and assigns work items to multiple worker threads working on items for the designated job. Under direction from the coordinator and director, a manager process maintains the appropriate number of active threads for a configured impact level, and for the node’s current activity level. Once a job has completed, the manager processes associated with that job, across all the nodes, are terminated. And new managers are automatically spawned when the next job is moved into execution.
The manager processes on each node regularly send updates to their respective node’s director, which, in turn, informs the coordinator process of the status of the various worker tasks.
Each worker thread is given a task, if available, which it processes item-by-item until the task is complete or the manager un-assigns the task. The status of the nodes’ workers can be queried by running the CLI command “isi job statistics view”. In addition to the number of current worker threads per node, a sleep to work (STW) ratio average is also provided, giving an indication of the worker thread activity level on the node.
Towards the end of a job phase, the number of active threads decreases as workers finish up their allotted work and become idle. Nodes which have completed their work items just remain idle, waiting for the last remaining node to finish its work allocation. When all tasks are done, the job phase is considered to be complete and the worker threads are terminated.
As jobs are processed, the coordinator consolidates the task status from the constituent nodes and periodically writes the results to checkpoint files. These checkpoint files allow jobs to be paused and resumed, either proactively, or in the event of a cluster outage. For example, if the node on which the Job Engine coordinator was running went offline for any reason, a new coordinator would be automatically started on another node. This new coordinator would read the last consistency checkpoint file, job control and task processing would resume across the cluster from where it left off, and no work would be lost.
Job engine checkpoint files are stored in ‘results’ and ‘tasks’ subdirectories under the path ‘/ifs/.ifsvar/modules/jobengine/cp/<job_id>/’ for a given job. On large clusters and/or with a job running at high impact, there can be many checkpoint files accessed from all nodes, which may result in contention. Checkpoints are split into sixteen subdirectories under both tasks and results to alleviate this bottleneck.