Built atop the partitioned performance (PP) resource monitoring framework, OneFS 9.5 introduces a new SmartQoS performance management feature. SmartQoS allows a cluster administrator to set limits on the maximum number of protocol operations per second (Protocol Ops) that individual pinned workloads can consume, in order to achieve desired business workload prioritization. Among the benefits of this new QoS functionality are:
- Enabling IT infrastructure teams to achieve performance SLAs.
- Allowing throttling of rogue or low priority workloads and hence prioritization of other business critical workloads.
- Helping minimize data unavailability events due to overloaded clusters.
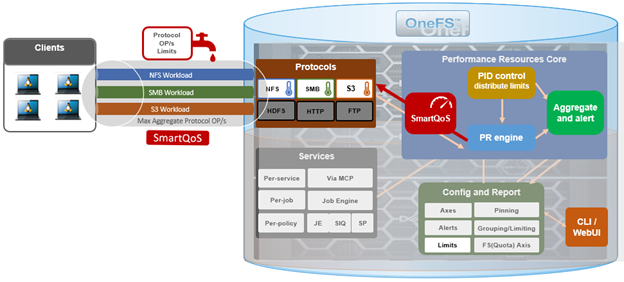
This new SmartQoS feature in OneFS 9.5 supports the NFS, SMB and S3 protocols, including mixed traffic to the same workload.
But first, a quick refresher. The partitioned performance resource monitoring framework, which initially debuted in OneFS 8.0.1, enables OneFS to track and report the use of transient system resources (resources that only exist at a given instant), providing insight into who is consuming what resources, and how much of them. Examples include CPU time, network bandwidth, IOPS, disk accesses, and cache hits, etc.
OneFS partitioned performance is an ongoing project which, in OneFS 9.5 now provides control as well as insights. This allows control of work flowing through the system, prioritization and protection of mission critical workflows, and the ability to detect if a cluster is at capacity.
Since identification of work is highly subjective, OneFS partitioned performance resource monitoring provides significant configuration flexibility, allowing cluster admins to craft exactly how they wish to define, track, and manage workloads. For example, an administrator might want to partition their work based on criterial like which user is accessing the cluster, the export/share they are using, which IP address they’re coming from – and often a combination of all three.
OneFS has always provided client and protocol statistics, however they were typically front-end only. Similarly, OneFS provides CPU, cache and disk statistics, but they did not display who was consuming them. Partitioned performance unites these two realms, tracking the usage of the CPU, drives and caches, and spanning the initiator/participant barrier.
OneFS collects the resources consumed, grouped into distinct workloads, and the aggregation of these workloads comprise a performance dataset.
| Item | Description | Example |
| Workload | A set of identification metrics and resources used | {username:nick, zone_name:System} consumed {cpu:1.5s, bytes_in:100K, bytes_out:50M, …} |
| Performance Dataset | The set of identification metrics to aggregate workloads by
The list of workloads collected matching that specification |
{usernames, zone_names} |
| Filter | A method for including only workloads that match specific identification metrics. | Filter{zone_name:System}
· {username:nick, zone_name:System} · {username:jane, zone_name:System} · {username:nick, zone_name:Perf} |
The following metrics are tracked by partitioned performance resource monitoring:
| Category | Items |
| Identification Metrics | · Username / UID / SID
· Primary Groupname / GID / GSID · Secondary Groupname / GID / GSID · Multi-tenant access zone Name · Local/Remote IP Address/Range · Path · Share / Export ID · Protocol · System Name · Job Type |
| Transient Resources | · CPU Usage
· Bytes In/Out – Net traffic minus TCP headers · IOPs – Protocol OPs · Disk Reads – Blocks read from disk · Disk Writes – Block written to the journal, including protection · L2 Hits – Blocks read from L2 cache · L3 Hits – Blocks read from L3 cache · Latency – Sum of time taken from start to finish of OP o ReadLatency o WriteLatency o OtherLatency |
| Performance Statistics | · Read/Write/Other Latency |
| Supported Protocols | · NFS
· SMB · S3 · Jobs · Background Services |
Be aware that, in OneFS 9.5, SmartQoS currently does not support the following Partitioned Performance criteria:
| Unsupported Group | Unsupported Items |
| Metrics | • System Name
• Job Type |
| Workloads | • Top workloads (as they are dynamically and automatically generated by kernel)
• Workloads belonging to the ‘system’ dataset |
| Protocols | • Jobs
• Background services |
When pinning a workload to a dataset, note that the more metrics there are in that dataset, the more parameters need to be defined when pinning to it. For example:
Dataset = zone_name, protocol, username
To set a limit on this dataset, you’d need to pin the workload by also specifying the multi-tenant access zone name, protocol, and username.
When using the remote_address and/or local_address metrics, you can also specify a subnet. For example: 10.123.456.0/24
With the exception of the system dataset, performance datasets must be configured before statistics are collected.
For SmartQoS in OneFS 9.5, limits can be defined and configured as a maximum number of protocol operations (Protocol Ops) per second across the following protocols:
- NFSv3
- NFSv4
- NFSoRDMA
- SMB
- S3
A Protocol Ops limit can be applied to up to 4 custom datasets. All pinned workloads within a dataset can have a limit configured, up to a maximum of 1024 workloads per dataset. If multiple workloads happen to share a common metric value with overlapping limits, the lowest limit that is configured would be enforced
Note that, on upgrading to OneFS 9.5, SmartQoS is activated only once the new release has been successfully committed.
In the next article in this series, we’ll take a deeper look at SmartQoS’ underlying architecture and workflow.