Among the useful data and network analysis tools that OneFS provides is the isi_netlogger utility. Netlogger captures IP traffic over a period of time for network and protocol analysis.
Under the hood, isi_netlogger is a python wrapper around the ubiquitous tcpdump utility. Netlogger can be run either from the OneFS command line or WebUI.
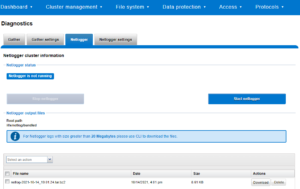
For example, from the WebUI, browse to Cluster management > Diagnostics:
Alternatively, from the OneFS CLI, the isi_netlogger command captures traffic on interface (‘-i’) over a timeout period of minutes (‘-t’), and stores a specified number of log files,as defined by the keep_count, or ‘-k’ parameter.
Using the ‘-b’ bpf buffer size option will temporarily change the default buffer size while netlogger is running. Netlogger’s log files are stored by default under /ifs/netlog/<node_name>.
Here’s the basic syntax of the tool:
isi_netlogger [-c launch clustered mode (run on all nodes)]

              [-n run on specified nodes (ex: -n 1,3)]

              [-d run as daemon]

              [-q quiet mode (redirect output to logs)]

              [-k keep_count of logs (default 3, to keep all logs use 0)]

              [-t timeout (default 10) ]

              [-s snaplen (default 320) ]

              [-b bpf buffer size in bytes, KB, or MB (end with 'k' or 'm') ]

              [-i interface name[,..] | all (ex: -i em0 or -i em0,em1 or -i all)]

              [-a ARP packets included. Normally filtered out ]

              [-p print out the tcpdump command ]

              [-z do not bundle capture files (default bundling is done)]

              [-- tcpdump filtering options]
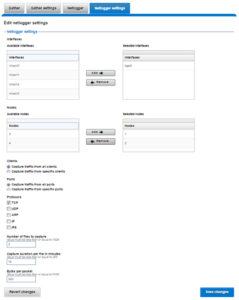
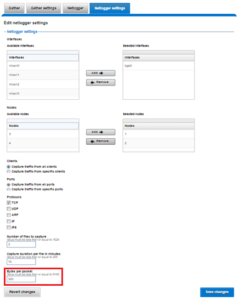
The WebUI can also be used to configure the netlogger parameters under Cluster management > Diagnostics > Netlogger settings:
Be aware that ‘isi_for_array isi_netlogger’ will consume significant cluster resources. When running the tool on a production cluster, be cognizant of the effect on the system.
When the command has completed, the capture file(s) are stored under the /ifs/netlog directory.
The following command can also be used to incorporate netlogger output files into an isi_gather_info bundle:
# isi_gather_info -n [node#] -f /ifs/netlog
To capture on multiple nodes of the cluster, the netlogger command can be prefixed by the versatile isi_for_array utility:
# isi_netlogger -n 2,3 -t 5 -k 864 -s 256
The command syntax above will create five minute incremental files on nodes 2 and 3, using a snaplength of 256 bytes, which will capture the first 256 bytes of each packet. These five-minute logs will be kept for about three days and the naming convention is of the form netlog-<node_name>-<date>-<time>.pcap. For example:
# ls

/etc/netlog/lab-cluster-1/netlog-lab_cluster-1.2021-10-18_20.24.38.pcap
When using isi_netlogger, the ‘-s’ flag needs to be set appropriately based on the protocol being to capture the right amount of detail in the packet headers and/or payload. Or, if you want the entire contents of every packet, a value of zero (‘-s 0’) can be used.
The default snaplength for netlogger is to use a snaplen of 320 bytes per packet, which is usually enough for most protocols.
However, for SMB, a snaplength of 512 is sometimes required. However, depending on a node’s traffic quantity, a snaplen of 0 (eg: capture whole packet) can potentially overwhelm the nic driver.
All the output gets written to files under /ifs/netlog and the default capture time is ten minutes (‘-t 10’).
Filters can be applied to the filter to the end to constrain traffic to/from certain hosts or protocols. For example, to limit output to traffic between client 10.10.10.1:
# isi_netlogger -t 5 -k 864 -s 256 -- host 10.10.10.1
Or to capture NFS traffic only, filter on port 2049:
# isi_netlogger -- port 2049
Or multiple ports:
# isi_netlogger -- port 2345 or port 5432
To capture from a non-standard interface can sometime require a bit of creativity:
# isi_netlogger -p -t 5 -k 864 -s 256 -a -- " -i vlan0 host 192.168.10.1"
The -p flag to print out the tcpdump command it is running. And, essentially, anything following a double dash flag ‘–‘ is passed as a normal tcpdump filter/option.
To capture across differing interface names across the cluster:
# isi_netlogger -i \`ifconfig |grep -B2 'inet <ip_addr>.' | grep flags= | awk -F: '{ print $1 }'\` -s 0 -a
Where <ip_addr> is as much of the public IP address that is common across all the nodes. For example “192.” or “192.168.”.
To stop netlogger before a command has completed, a simple ‘isi_for_array killall tcpdump’ can be used to terminate any active tcpdump/netlogger sessions across a cluster. If any processes do remain after this, these can all be killed with a command along the lines of:
# isi_for_array -s "kill -9 \`ps auxw|grep netlog|grep -v grep|awk {'print \$2'}\`;killall -9 tcpdump"