SmartQuotas employs the OneFS job engine to execute its work. Specifically, the QuotaScan job updates the accounting for quota domains created on an existing directory path. Although it is typically run without any intervention, the administrator has the option of manually control if necessary or desirable.
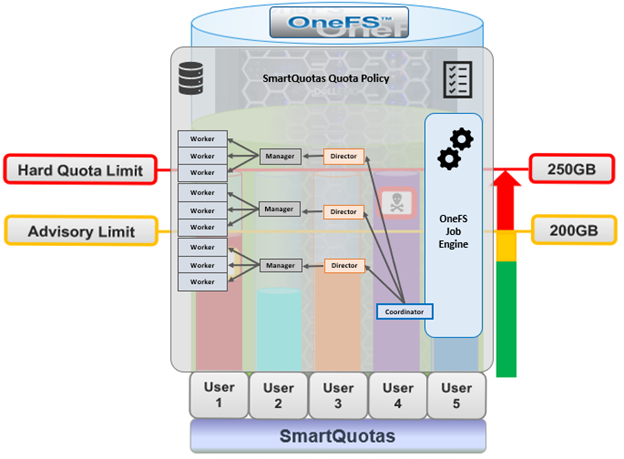
The OneFS job engine is based on a delegation hierarchy made up of coordinator, director, manager, and worker processes.
Once a SmartQuotas job is initially allocated, the job engine uses a shared work distribution model in order to execute the work, and each job is identified by a unique Job ID. When a job is launched, whether it’s scheduled, started manually, or responding to a cluster event, the Job Engine spawns a child process from the isi_job_d daemon running on each node. This job engine daemon is also known as the parent process.
The entire job engine’s orchestration is handled by the coordinator, which is a process that runs on one of the nodes in a cluster. While the actual work item allocation is managed by the individual nodes, the coordinator node takes control, divides up the job, and evenly distributes the resulting tasks across the nodes in the cluster. It is also responsible for starting and stopping jobs, and also for processing work results as they are returned during the execution of a job.
Each node in the cluster has a job engine director process, which runs continuously and independently in the background. The director process is responsible for monitoring, governing and overseeing all job engine activity on a particular node, constantly waiting for instruction from the coordinator to start a new job. The director process serves as a central point of contact for all the manager processes running on a node, and as a liaison with the coordinator process across nodes.
Manager processes are responsible for arranging the flow of tasks and task results throughout the duration of a job. Each manager controls and assigns work items to multiple worker threads working on items for the designated job. Under direction from the coordinator and director, a manager process maintains the appropriate number of active threads for a configured impact level, and for the node’s current activity level.
Each worker thread is given a task, if available, which it processes item-by-item until the task is complete or the manager un-assigns the task. Towards the end of a job phase, the number of active threads decreases as workers finish up their allotted work and become idle. Nodes which have completed their work items just remain idle, waiting for the last remaining node to finish its work allocation. When all tasks are done, the job phase is considered to be complete, and the worker threads are terminated.
By default, QuotaScan runs with a ‘low’ impact policy and a low-priority value of ‘6’.
If quotas are created on empty directories, governance will instantaneously propagate from parent to child incrementally. If the directory is not empty, the QuotaScan job is used to update the governance.
A domain created on a non-empty directory will not be marked as ready. This triggers a QuotaScan job to be started, and it performs a treewalk to traverse the directory tree under the domain root.
The QuotaScan job is the cluster maintenance process responsible for scanning the cluster to performing accounting activities to bring the determined governance to each inode. In essence, the job is a distributed tree walk that is performed based on the state of the domain.
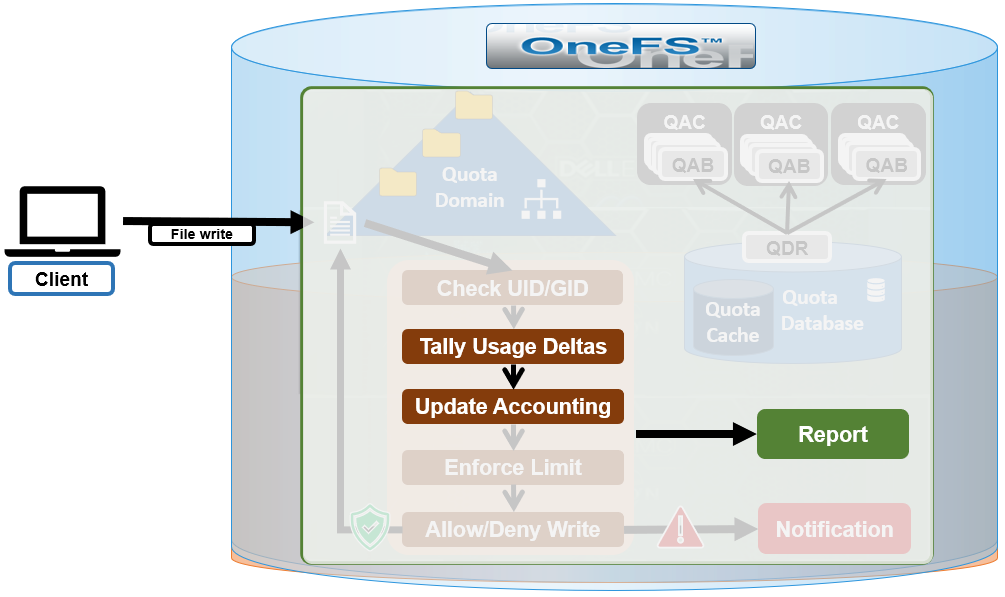
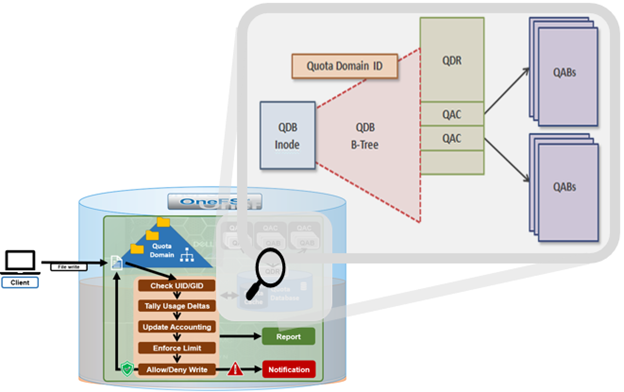
Under the hood, SmartQuotas is based on the concept of domains – the linchpins of quota accounting. Since OneFS is a single file system, it relies on domains for defining the scope of a quota in place of the typical volume boundaries found in most storage systems. As such, a domain defines which files belong to a quota, accounts for each resource type in that set and defines the top-level directory configuration point.
For SmartQuotas, the three main resource types are:
| Resource Type |
Description |
| Directory |
A specific directory and all its subdirectories |
| User |
A specific user |
| Group |
All members of a specific group |
A domain defined as “name@folder” would be the set of files under “folder,” owned by “name,” which could be either a user or a group. The files accounted include all files reachable from the given path, without traversing any soft links. The owner “name” can be ALL, and “/ifs,” the OneFS root directory, is also an effective ALL for “folder.”
With SmartQuotas, it is easy to create traditional domain types quickly by using “ALL.” The following are examples of domain types:
- All files belonging to user Jane: user:Jane@/ifs
- All files under /ifs/home, belonging to any user: ALL@/ifs/home.
- All files under /ifs/home that belong to user Jane: user:Jane@/ifs/home
Domains cannot be created on anything but directories. More specifically, domains are associated with the actual directories themselves, not directory paths. For example, if the domain is ALL@/ifs/home/data, but /ifs/home/data gets renamed to /ifs/home/files, the domain stays with the directory.
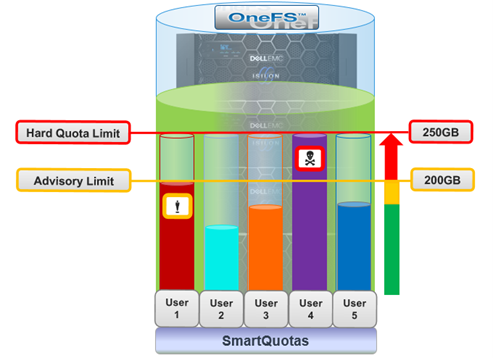
Domains can also be nested and may overlap. For example, say a hard quota is set on /ifs/data/marketing for 5 TB. 1 TB soft quotas are then placed on individual users in the marketing department. This ensures that the marketing directory as a whole never exceeds 5 TB, while limiting the users in the marketing department to 1 TB each.
A default quota domain is one that does not account for any specific set of files but instead specifies a policy for new domains that match a specific trigger. In other words, default domains are configuration templates for actual domains. SmartQuotas use the identity notation ‘default-user’, ‘default-group’, and ‘default directory’ to describe domains with default policies. For example, the domain default-user@/ifs/home becomes specific-user@/ifs/home for each specific-user that is not otherwise defined. All enforcements on default-user are copied to specific-user when specific-user allocates within the domain and the new inherited domain quota is termed as a Linked Quota. There may be overlapping defaults (default-user@/ifs and default-user@/ifs/home may both be defined).
Default quota domains help drastically simplify quota management for large environments by providing a mechanism to define top-level template configurations from which many actual quotas can be cloned, or linked. When a default quota domain is configured on a directory, any subdirectories created directly underneath this will automatically inherit the quota limits specified in the parent domain. This streamlines the provisioning and management quotas for large enterprise environments. Furthermore, default directory quotas can co-exist with user and/or group quotas and legacy default quotas.
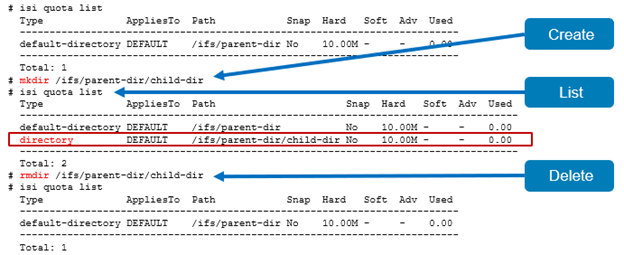
Default directory quotas have been available since OneFS 8.2, in addition to the default user and group quotas available in earlier releases. For example:
- Create default-directory quota
# isi quota create --path=/ifs/parent-dir --type=default-directory --hard-threshold=10M
- Modify Default directory quota
# isi quota modify --path=/ifs/parent-dir --type=default-directory --advisory-threshold=6M --soft-threshold=7M --soft-grace=1D
- List default-directory quota
# isi quota list


  Type              AppliesTo  Path            Snap  Hard   Soft  Adv  Used


  --------------------------------------------------------------------------


  default-directory DEFAULT    /ifs/parent-dir No    10.00M -    6.00M 0.00


  --------------------------------------------------------------------------


  Total: 1
- Delete Default directory quota
# isi quota delete --path=/ifs/parent-dir --type=default-directory
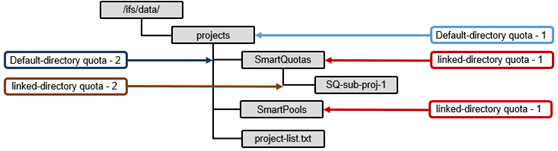
If the enforcements on a default domain change, SmartQuotas will automatically propagate the changes to the Linked Quota domains. If a default quota domain is deleted, SmartQuotas will delete all children marked as inherited. An administrator may also choose to delete the default without deleting the children, but this will break inheritance on all inherited children.
For example, the creation & deletion of sub-directory under default directory folder causes inherited directory quota creation and removal:
A quota domain may be in one of three accounting states as described in the following table:
| Quota Accounting States |
Description |
| Ready |
A domain in the ready state is fully accounted. SmartQuotas displays “ready” domains in all interfaces and all enforcements apply to such domains. |
| Accounting |
A domain is placed in the Accounting state when it is waiting on accounting updates. |
| Deleting |
After a request to delete a domain, SmartQuotas will place the domain in the deleting state until tear-down is complete. Domain removal may be a lengthy process. |
SmartQuotas displays accounting domains in all interfaces including usage data but indicate they are in the process of being “Accounted.” SmartQuotas applies all enforcements to accounting domains, even when it might reject an allocation that would have proceeded if it had completed the QuotaScan.
Domains in the deleting state are hidden from all interfaces, and the top-level directory of a domain may be deleted while the domain is still in the deleting state (assuming there are no domains in “Ready” or “Accounting” state defined on the directory). No enforcements are applied for domains in “Deleting” state.
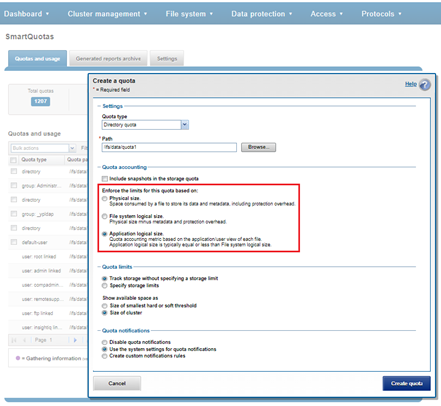
A quota scan is performed when the domain is in an Accounting State. This can occur during quota creation to account the new domain if a quota has been set for the domain and quota deletion to un-account the domain. A QuotaScan is required when creating a quota on a non-empty directory. If quotas are created up-front on an empty directory, no QuotaScan is necessary.
A QuotaScan job may be started either from the WebUI or CLi with the following syntax:.
# isi job jobs start quotascan
Any path specified on the command line is treated as the root of a tree that should be processed. This is provided primarily as a means to rescan a directory or maintenance reasons.
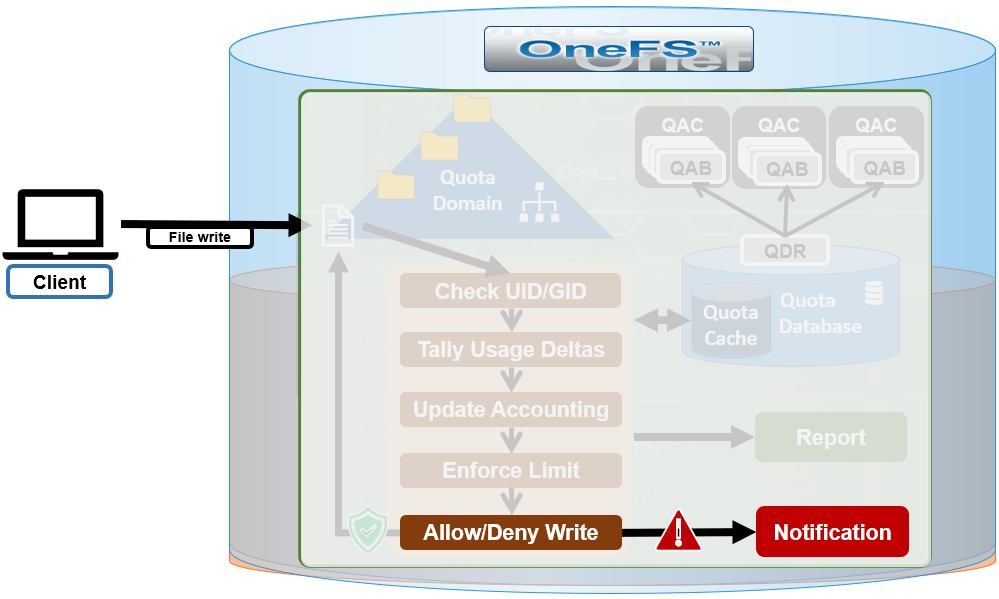
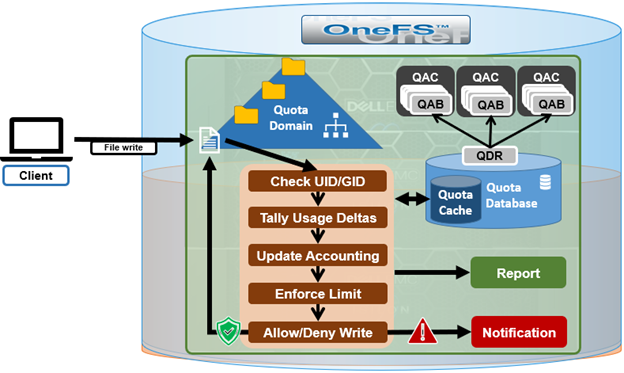
In addition to the core isi_smartquoatas service, there are three processes, or daemons, associated with SmartQuotas:
| Daemon |
Details |
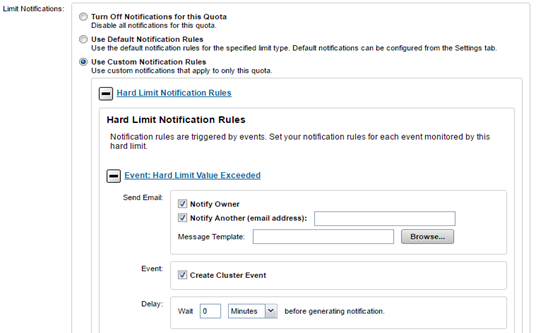
| isi_quota_notify_d |
Listens for ‘limit exceeded’ and ‘link denied’ events and generate notifications for each. Also responds to configuration change events and instructs the QDB to generate ‘expired’ and ‘violated’ over-threshold notifications. |
| isi_quota_report_d |
Generates quota reports. Since the QDB only produces real-time resource usage, reports are necessary for providing point-in-time vies of a quota domain’s usage. These historical reports are useful for trend analysis of quota resource usage. |
| isi_quota_sweeper_d |
Responsible for quota housekeeping tasks such as propagating default changes, domain and notification rule garbage collection, and kicking off QuotaScan jobs when necessary. |
These can be viewed as follows:
# isi services -a | grep -i quota

   isi_smartquotas      SmartQuotas Service                      Enabled

# ps -auxw | grep -i quota

root    4852    0.0  0.0  26708   8404  -  Is   Sat20        0:00.00 /usr/sbin/isi_quota_report_d

root    4860    0.0  0.0  26812   8424  -  Is   Sat20        0:00.00 /usr/sbin/isi_quota_notify_d

root    4872    0.0  0.0  26836   8488  -  Is   Sat20        0:00.00 /usr/sbin/isi_quota_sweeper_d
OneFS 8.2 and later also include the rpc.quotad service to facilitate client-side quota reporting on UNIX and Linux clients using native ‘quota’ tools. The service which runs on tcp/udp port 762 is enabled by default, and control is under NFS global settings.
Also, users can view their available user capacity set by soft or hard user and group quotas rather than the entire cluster capacity or parent directory-quotas. This avoids the ‘illusion’ of seeing available space that may not be associated with their quotas.
SmartQuotas is included as a core component of OneFS but requires a valid product license key in order to activate. This license key can be purchased through your Dell EMC account team. An unlicensed cluster will show a SmartQuotas warning until a valid product license has been purchased and applied to the cluster.
License keys can be easily added through the ‘Activate License’ section of the OneFS WebUI, accessed by going to Cluster Management > Licensing.