Self-encrypting drives (SEDs), are secure storage devices which transparently encrypt all on-disk data using an internal key and a drive access password. OneFS uses nodes populated with SED drives in to provide data-at-rest encryption (DARE), thereby preventing unauthorized access data access. Encrypting data at rest with cryptography ensures that the data is protected from theft, or other malicious activity, in the event drives or nodes are removed from a PowerScale cluster. Ensuring that data is encrypted when stored is mandated for federal and many industry regulations, and OneFS DARE satisfies a number of compliance requirements, including U.S. Federal FIPS 104-3 Level 3 and PCI-DSS v2.0 section 3.4.
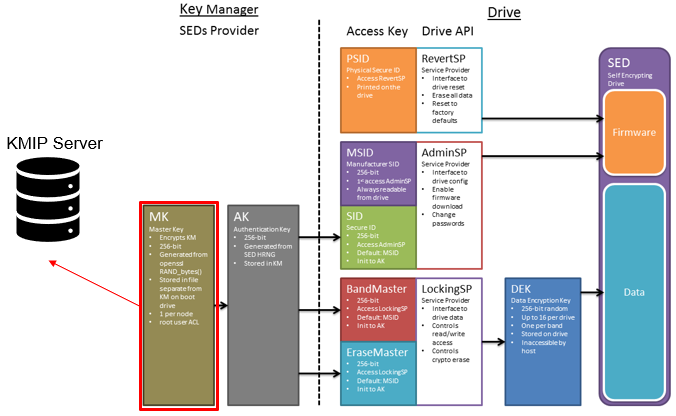
All data that is written to a DARE cluster is automatically encrypted the moment it is written and decrypted when it is read. The stored data is encrypted with a 256-bit data AES data encryption key (DEK), and OneFS controls data access by combining the drive authentication key (AK) with data-encryption keys.
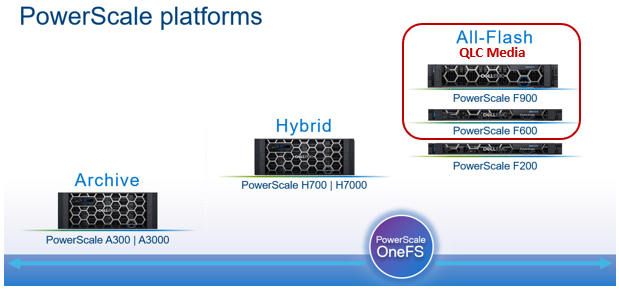
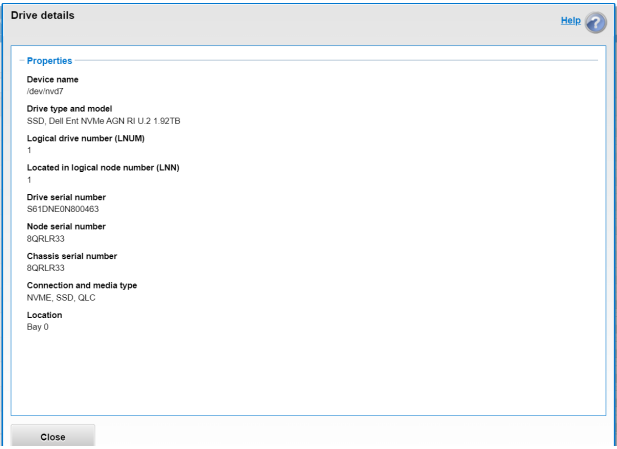
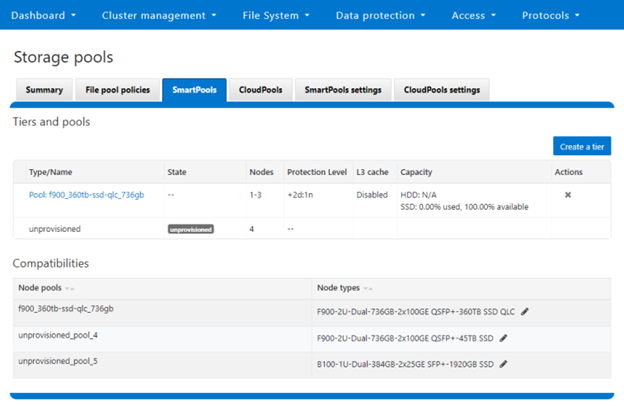
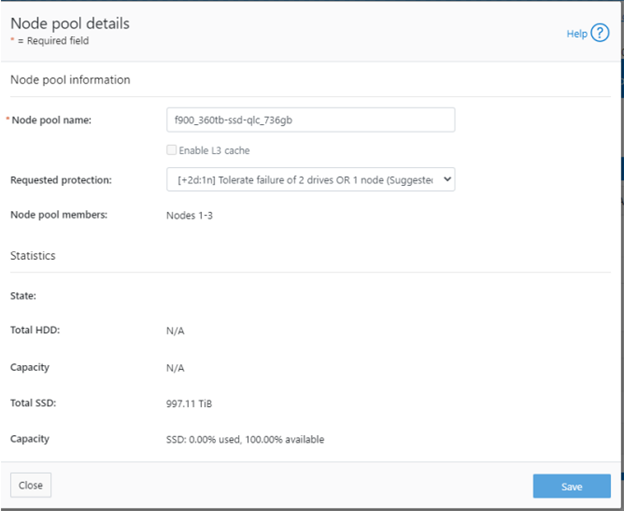
OneFS supports data-at-rest encryption using SEDs across all-flash SSD nodes, as well as HDD-based hybrid and archive platforms. However, all nodes in a DARE cluster must be of the self-encrypting drive type, and mixed SED and non-SED node clusters are not supported.
SEDs have the ability to be ‘locked’ or ‘unlocked’, over configurable ranges of logical block addresses (LBAs) known as ‘bands’. The bands on OneFS storage drives cover the /ifs and reserved partition, but leave a small amount at the beginning and end of the drive unlocked for the partition table. When OneFS formats a drive, isi_sed ‘takes ownership’ of it, which refers to us setting a password on the drive and storing it in the keystore. Similarly, ‘releasing ownership’ refers to resetting the drive back to a known password – the MSID, which is a password provided by the manufacturer, which can be read from the drive itself. Releasing ownership means that isi_sed will be able to use the MSID to authenticate to the drive and take ownership of it again if need be. It’s worth noting that changing these passwords changes the drive’s internal encryption key, and will scramble all data on the drives.
New PowerScale encryption nodes, and the SED drives they contain, initially arrive in an ‘unowned’, factory-fresh state, with encryption is disabled and no encryption keys present on the drives or node. On initialization, first a randomized internal drive encryption key is generated via the drive’s embedded encryption hardware. This key is used by the drive hardware to encrypt all incoming data before writing it to disk, and to decrypt any disk data being read by the node.
Next, a drive control key or drive access password is generated via the OneFS key manager process. This password is used each time the drive is accessed by the node. Without the password, the drive is completely inaccessible. With encryption now configured, the drive is in a secure, owned state and is ready to be formatted.
The data on self-encrypting drives is rendered inaccessible in the following conditions:
| Event |
Description |
| Smartfail |
When a self-encrypting drive is smartfailed, drive authentication keys are deleted, making the drive unreadable. When you smartfail and then remove a drive, it is cryptographically erased. NOTE: Smartfailing a drive is the preferred method for removing a self-encrypting drive. |
| Power loss |
When a self-encrypting drive loses power, the drive locks to prevent unauthorized access. When power is restored, data is again accessible when the appropriate drive authentication key is provided. |
| Network loss |
When a cluster using external key management loses network connection to the external key management server, the drives are locked until the network connection is restored. |
| Password Loss |
If a SED drive’s internal key or drive access password is lost, the drive data is rendered permanently inaccessible, and the drive must be reset and reformatted in order to be repurposed. |
If a SED drive is tampered with, say by interrupting the formatting process or removing the drive from a powered-on node for example, the node will automatically delete its drive access password from the keystore database where the drive access passwords are stored. If the internal drive key, drive access password, or both are lost or deleted, all of the data on the drive becomes permanently inaccessible and unreadable. This process is referred to as cryptographic erasure, as the data still exists, but can’t be decrypted. The drive is subsequently unusable, and it must be manually reverted to the unowned state by using its Physical Security ID (PSID). The PSID is a unique, static, 32-character key that is embedded in each drive at the factory. PSIDs are printed on the drive’s label, and can be retrieved only by physically removing the drive from the node and reading its label. After the PSID is entered in the OneFS command-line interface at the manual reversion prompt, all of the drive data is deleted and the SED drive is returned to an unowned state.
SEDs include a few additional isi_drive_d user states, as compared to regular drives.
| SED State |
Description |
| SED_ERROR |
OneFS could not unlock or use the drive, typically because of a bad password or drive communication error. |
| ERASE |
The drive finished a smartfail, but OneFS was unable to release the drive, so just deleted its password. |
| INSECURE |
The drive isn’t owned by the node, but was unlocked and would have otherwise gone to ACTIVE. |
Generally, these will only be reported in error cases. SEDs that are working properly and unlocked should behave like any other drives, and when running and in-use will show up as HEALTHY. That said, the most common error state is drives that show up as SED_ERROR. However, this just indicates that drive_d encountered anything other than SUCCESS or DRIVE_UNOWNED when attempting to unlock the drive.
To help debug a SED issue, determine if the drive is currently owned (non-MSID password), or unowned (default, MSID password) and test with the ‘isi_sed drivedisplay’ CLI command. If the drive is unowned, or the password does not work, you’ll likely need to PSID revert the drive.
| Syntax |
Description |
| isi_sed drivedisplay <drive> |
Displays the drive’s current state of ownership. This is often the most directly helpful, since it should be obvious based on this whether error states are legitimate or not. If the command succeeds, you should be told either: drive is unowned, drive owned by this node, drive owned by another node.
· ‘Drive owned by another node’ is the error case you can expect to see if we had a key and lost it, or you moved drives from node to node. This means the drive is locked and we don’t have a password – you’ll have to revert it or restore your lost passwords.
· ‘Drive owned by this node’ is expected in most situations. – we have a
· ‘Drive unowned’ can be either an error or unexpected case. Drives that are released or reverted should be in this state. Drives that have been formatted and are in-use should not. This means the drive is using the MSID (factory default) password. |
| isi_sed release <drive> |
Releases ownership of this drive. This will set the drive’s password back to the default, the drive’s MSID. This can be helpful for cases such as moving drives around – this will release a drive so that any other node/isi_sed can take ownership of the drive. |
| isi_sed revert <drive> |
This command is useful for lost passwords, etc. The revert operation will allow you to enter the PSID found on the drive, and with that reset the drive to a factory-fresh MSID-unlocked state. Another way to do this is to attempt an “isi dev -a format -d :[baynum of drive to revert]” – you will be prompted for the PSID, and drive_d will attempt to do the revert for you. |
A healthy SED drive can easily be securely erased by simply Smartfailing the drive. Once the Smartfail process has completed, the node deletes the drive access password from the keystore and the drive deletes its internal encryption key. At this point, the data is inaccessible and is considered cryptographically erased, and the drive is reset back to its original ‘unowned’ state. The drive can then be reused once a new encryption key has been generated, or safely returned to Dell, without any risk of the vendor or a third party accessing the data.
In order to ensure that data on a SED is unreadable, during a successful Smartfail OneFS cryptographically erases data by changing the DEK and blocks read and write access to existing data by removing the access key. However, if the drive fails to respond during Smartfail and OneFS cannot perform cryptographic erasure, access to the drive’s data is still blocked by deleting the access key.
| Smartfail State |
DEK erased and reset |
AK erased and reset |
Cryptographic erasure |
Data inaccessible |
| Replace |
Yes |
Yes |
Yes |
Yes |
| Erase |
|
Yes |
|
Yes |
For a defective SED drive, the completion of the Smartfail process prompts the node to delete the drive access password from the keystore.
To erase all SED drives in a single node that is being removed from a cluster, smartfail the node from the cluster. All drives will be automatically released and cryptographically erased by the node when the smartfail process completes.
On completion of the Smartfail process, a node automatically reboots to the configuration wizard. The /var/log/isi_sed log log will contains a ‘release_ownership’ message for each drive as it goes through the Smartfail process, confirming it is in a ‘replace’ state. For example:
2022-05-25T22:45:56Z <1.6>H400-SED-4 isi_sed[46365]: Command: release_ownership, drive bays: 1

2022-06-25T22:46:39Z <1.6>H400-SED-4 isi_sed[46365]: Bay 1: Dev da1, HITACHI H5SMM328 CLAR800, SN 71V0G6SX, WWN 5000cca09c00d57f: release_ownership: Success
The following CLI command can be used cryptographically erase a SED by smartfailing the drive, in this case drive 10 on node 1:
# isi devices -a smartfail -d 1:10
The status of an ‘owned’ drive, in this case /dev/da10, is reported as such:
# isi_sed drive da10 -vDrive Status: Bay 10: WWN 5000c50056252af4Drive Model SEAGATE ST330006CLAR3000, SN 71V0G6SX 00009330KYE04Key Key MSID Drive DriveExists Works Works State Status======= ======= ======= =============== ===============Yes Yes No OWNED OWNEDDrive owned by nodeBay 10: Dev da10, SEAGATE ST330006CLAR3000, SN 71V0G6SX 00009330KYE04, WWN 5000c50056252af4: drive_display: Success
This drive can easily be ‘released’ as follows:
# isi_sed release da10 -vDrive Status: Before release_ownership (Restore drive to factory default state):Drive Status: Bay 10: WWN 5000c50056252af4Drive Model SEAGATE ST330006CLAR3000, SN 71V0G6SX 00009330KYE04Key      Key      MSID     Drive            DriveExists   Works    Works    State            Status=======  =======  =======  ===============  ===============Yes      Yes      No       OWNED            OWNEDDrive owned by nodeBay 10: Dev da10, SEAGATE ST330006CLAR3000, SN 71V0G6SX 00009330KYE04, WWN 5000c50056252af4: release_ownership: Success

isi_sed drive da10 -v

Drive Status: Bay 10: WWN 5000c50056252af4

Drive Model SEAGATE ST330006CLAR3000, SN 71V0G6SX 00009330KYE04

Key      Key      MSID     Drive            Drive

Exists   Works    Works    State            Status

=======  =======  =======  ===============  ===============

No       No       Yes      UNOWNED          UNOWNED

Fresh unowned drive

Firmware Port Lock: Enabled, AutoLock: On Power Loss


              Auth Keys:               ReadLock   WriteLock  Auto   LBA       LBA

              MSID Curr Futr Chng Unkn Enb  Set   Enb  Set   Lock   Start     Size

============  ======================== ========== ========== =====  ========= =========

SID           Y    --   --   --

EraseMaster   Y    --   --   --

BandMaster0   Y    --   --   --        N    N     N    N     N      0         0

BandMaster1   Y    --   --   --        N    N     N    N     N      0         0

BandMaster2   Y    --   --   --        N    N     N    N     N      0         0

BandMaster3   Band Disabled

BandMaster4   Band Disabled

BandMaster5   Band Disabled

BandMaster6   Band Disabled

BandMaster7   Band Disabled

BandMaster8   Band Disabled

BandMaster9   Band Disabled

BandMaster10  Band Disabled

BandMaster11  Band Disabled

BandMaster12  Band Disabled

BandMaster13  Band Disabled

BandMaster14  Band Disabled

Bay 10: Dev da10, SEAGATE ST330006CLAR3000, SN 71V0G6SX 00009330KYE04, WWN 5000c50056252af4: drive_display: Success
Similarly, all of the SEDs in a node can be erased by Smartfailing the entire node, in this case node 2:
# isi devices -a smartfail -d <node>
The ‘isi_reformat_node’ CLI tool can be used to either reimage or reformat a single node or entire cluster, thereby erase all its SED drives. Either a reformat or reimage will first ‘release’ the drives and then delete the node keystore. Plus, even if a drive fails to properly release, it will still be cryptographically erased since its drive access passwords is deleted along with the rest of the keystore during the process. However, note that any SED drives in nodes destined for redeployment elsewhere and which are currently in an unreleased state must be manually reverted by using their PSID before they can be used again.
# isi_reformat_node
The node will be automatically formatted. To erase all of the SEDs in an entire cluster, log in to each individual node as root and issue the above ‘isi_reformat_node’ command.
A drive that has been cryptographically erased can be verified as follow. First, use the ‘isi_drivenum’ CLI command to display the device names of the cluster’s drives. For example:
# isi_drivenum

Bay  1   Unit 0      Lnum 30    Active      SN:9VNX0JA02433     /dev/da1

Bay  2   Unit N/A    Lnum N/A   N/A         SN:N/A              N/A

Bay  A0   Unit 13     Lnum 17    Active      SN:0BHHH2TF         /dev/da14

Bay  A1   Unit 29     Lnum 1     Active      SN:0BHHHJRF         /dev/da30

Bay  A2   Unit 1      Lnum 29    Active      SN:0BHHH73F         /dev/da2

Bay  A3   Unit 16     Lnum 14    Active      SN:0BHHDL6F         /dev/da17

Bay  A4   Unit 2      Lnum 28    Active      SN:0BHHH7VF         /dev/da3

Bay  A5   Unit 17     Lnum 13    Active      SN:0BHHDYNF         /dev/da18

Bay  B0   Unit 30     Lnum 0     Active      SN:0BHKUBNH         /dev/da31

Bay  B1   Unit 14     Lnum 16    Active      SN:0BHHEBVF         /dev/da15

Bay  B2   Unit 18     Lnum 12    Active      SN:0BHDH7JF         /dev/da19

Bay  B3   Unit 3      Lnum 27    Active      SN:0BHHE6VF         /dev/da4

Bay  B4   Unit 19     Lnum 11    Active      SN:0BHDH9VF         /dev/da20

Bay  B5   Unit 4      Lnum 26    Active      SN:0BHHEEEF         /dev/da5

Bay  C0   Unit 15     Lnum 15    Active      SN:0BHHDLMF         /dev/da16

Bay  C1   Unit 26     Lnum 4     Active      SN:0BHHDNUF         /dev/da27

Bay  C2   Unit 5      Lnum 25    Active      SN:0BHHDL2F         /dev/da6

Bay  C3   Unit 20     Lnum 10    Active      SN:0BHHDKTF         /dev/da21

Bay  C4   Unit 6      Lnum 24    Active      SN:0BHHHGVF         /dev/da7

Bay  C5   Unit 21     Lnum 9     Active      SN:0BHHH4XF         /dev/da22

Bay  D0   Unit 27     Lnum 3     Active      SN:0BHHDKYF         /dev/da28

Bay  D1   Unit 11     Lnum 19    Active      SN:0BHHH9EF         /dev/da12

Bay  D2   Unit 22     Lnum 8     Active      SN:0BHHDL4F         /dev/da23

Bay  D3   Unit 7      Lnum 23    Active      SN:0BHHDWEF         /dev/da8

Bay  D4   Unit 23     Lnum 7     Active      SN:0BHHDSXF         /dev/da24

Bay  D5   Unit 8      Lnum 22    Active      SN:0BHHDKVF         /dev/da9

Bay  E0   Unit 12     Lnum 18    Active      SN:0BHHH9PF         /dev/da13

Bay  E1   Unit 28     Lnum 2     Active      SN:0BHHHGEF         /dev/da29

Bay  E2   Unit 9      Lnum 21    Active      SN:0BHHHAAF         /dev/da10

Bay  E3   Unit 24     Lnum 6     Active      SN:0BHHE06F         /dev/da25

Bay  E4   Unit 10     Lnum 20    Active      SN:0BHHDZTF         /dev/da11

Bay  E5   Unit 25     Lnum 5     Active      SN:0BHHDRBF         /dev/da26
Note that the drive device names are displayed in the format ‘/dev/da#’, where ‘#’ is a number. Only the ‘da#’ portion is needed for the isi_sed CLI syntax.
For example, to query the state of SED drive ‘da10’:
# isi_sed drive da10
Note that this command may take 30 seconds or longer to complete.
Finally, the data on the drive has been cryptographically erased if the ‘Drive State’ and ‘Drive Status’ columns display a status of UNOWNED, and ‘Fresh unowned drive’ appears in the line below the table. The drive has been reset and its internal encryption key has been destroyed, cryptographically erasing the drive. For example:
# isi_sed drive da10

Drive Status: Bay 10: WWN 5000c50056252af4

Drive Model SEAGATE ST330006CLAR3000, SN 71V0G6SX 00009330KYE04

Key      Key      MSID     Drive            Drive

Exists   Works    Works    State            Status

=======  =======  =======  ===============  ===============

No       No       Yes      UNOWNED          UNOWNED

Fresh unowned drive

Bay 10: Dev da10, SEAGATE ST330006CLAR3000, SN 71V0G6SX 00009330KYE04, WWN 5000c50056252af4: drive_display: Success
If the Drive State and Drive Status columns display a status of AUTH FAILED, this indicates that the drive password (AK) is no longer present in the node keystore. For example:
# isi_sed drive da10

Drive Status: Bay 10: WWN 5000c50056252af4

Drive Model SEAGATE ST330006CLAR3000, SN 71V0G6SX 00009330KYE04

Key      Key      MSID     Drive            Drive

Exists   Works    Works    State            Status

=======  =======  =======  ===============  ===============

No       No       Yes      AUTH FAILED      AUTH FAILED
Since the password is not stored anywhere else, the drive is now inaccessible until it is manually reverted.
If a drive is removed from a running node, OneFS automatically assumes that the drive has failed, and initiates the Smartfail process. If the drive is reinserted before the smartfail process completes, the ‘add’ and ‘stopfail’ commands can be run manually in order to bring the drive back online and return it to a healthy state. However, if the smartfail process has completed before reinserting the drive, running the stopfail command will be ineffective since the drive access password for the removed drive is deleted from the node’s keystore and is considered cryptographically erased.
However, if the drive is reinserted and added back to the cluster after it has been smartfailed, OneFS will report it as being in the SED_ERROR state because the drive still contains encrypted data but the drive access password no longer exists in the node’s keystore. Although the data on the drive is inaccessible, the drive can be reverted to an unowned state by using its PSID. At this point, the drive can then be reused.
When necessary, a SED drive can be cryptographically erased and reset to a factory-fresh state, either by issuing it the ‘release_ownership’ command, or by sending the ‘revert_factory_default’ command. For example, using drive /dev/da10:
# isi_sed release_ownership da10
Or:
# isi_sed revert_factory_default da10
The release command requires the drive password in order to run, whereas the revert command requires the drive physical PSID. If the drive password is still known and functional, the node can release the drive after the smartfail process completes, or during a node reimage, without requiring manual intervention. If the drive password is lost or no longer functional, the revert command must be used instead, and the PSID must be entered manually.
If a SED drive becomes inaccessible for any reason, such as mishandling, malfunction, intentional or accidental release/revert, or loss of the data access password, the drive data cannot be retrieved. Traditional data recovery techniques, such as direct media access and platter extraction, are ineffective on a SED drive since the data is encrypted, and the encryption key cannot be extracted from the drive hardware.
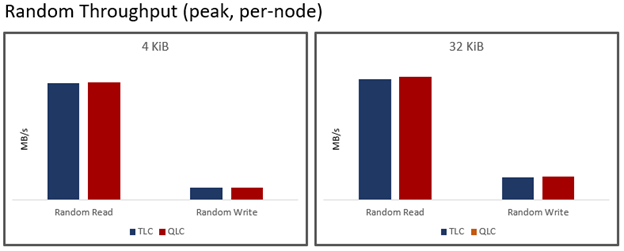
Performance-wise, there is no significant difference in read or write performance between SED and non-SED drives. All data encryption and decryption is done at line speed by dedicated AES encryption hardware that is embedded in the drive.
Format times for SED nodes may vary, but 90 minutes or more is the average for most 4TB SED nodes. The larger the drives, the longer the format process will take to complete. SED nodes take much longer to format than nodes with regular drives, because each drive must be fully overwritten with random data as part of the encryption initialization process. This is an industry-standard step in all full-disk encryption processes that is necessary to help secure the encrypted data against brute-force attacks on the encryption key, and this step cannot be skipped.
OneFS provides drive formatting progress information, which is displayed as a completion percentage for each drive.
It is important to avoid interrupting a formatting process on a SED node. Inadvertently doing so will immediately make all the drives in the node unusable, necessitating a manual revert for each individual drive using its PSID, before the format process can be restarted.
# isi_sed revert /dev/da1
Bear in mind that this can be a somewhat cumbersome process, which can take several hours.