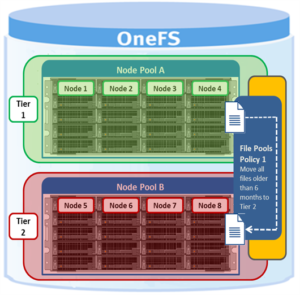
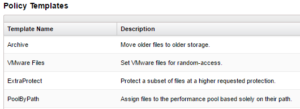
A OneFS file pool policy can be easily generated from either the CLI or WebUI. For example, the following CLI syntax creates a policy which archives older files to a lower storage tier.
# isi filepool policies modify ARCHIVE_OLD --description "Move older files to archive storage" --data-storage-target TIER_A --data-ssd-strategy metadata-write --begin-filter --file-type=file --and --birth-time=2021-01-01 --operator=lt --and --accessed-time= 2021-09-01 --operator=lt --end-filter
After a file match with a File Pool policy occurs, the SmartPools job uses the settings in the matching policy to store and protect the file. However, a matching policy might not specify all settings for the match file. In this case, the default policy is used for those settings not specified in the custom policy. For each file stored on a cluster, the system needs to determine the following:
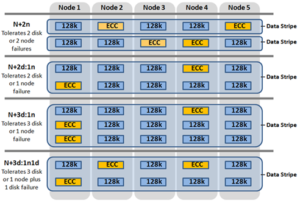
· Requested protection level
· Data storage target for local data cache
· SSD strategy for metadata and data
· Protection level for local data cache
· Configuration for snapshots
· SmartCache setting
· L3 cache setting
· Data access pattern
· CloudPools actions (if any)
If no File Pool policy matches a file, the default policy specifies all storage settings for the file. The default policy, in effect, matches all files not matched by any other SmartPools policy. For this reason, the default policy is the last in the file pool policy list, and, as such, always the last policy that SmartPools applies.
Next, SmartPools checks the file’s current settings against those the policy would assign to identify those which do not match. Once SmartPools has the complete list of settings that it needs to apply to that file, it sets them all simultaneously, and moves to restripe that file to reflect any and all changes to Node Pool, protection, SmartCache use, layout, etc.
Custom File Attributes, or user attributes, can be used when more granular control is needed than can be achieved using the standard file attributes options (File Name, Path, File Type, File Size, Modified Time, Create Time, Metadata Change Time, Access Time). User Attributes use key value pairs to tag files with additional identifying criteria which SmartPools can then use to apply File Pool policies. While SmartPools has no utility to set file attributes, this can be done easily by using the ‘setextattr’ command.
Custom File Attributes are generally used to designate ownership or create project affinities. Once set, they are leveraged by SmartPools just as File Name, File Type or any other file attribute to specify location, protection and performance access for a matching group of files.
For example, the following CLI commands can be used to set and verify the existence of the attribute ‘key1’ with value ‘val1’ on a file ‘attrib.txt’:
# setextattr user key1 val1 attrib.txt

# getextattr user key1 attrib.txt

file    val1
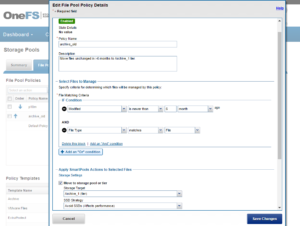
A File Pool policy can be crafted to match and act upon a specific custom attribute and/or value.
For example, the File Policy below, created via the OneFS WebUI, will match files with the custom attribute ‘key1=val1’ and move them to the ‘Archive_1’ tier:
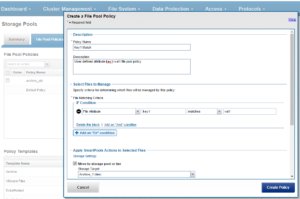
Once a subset of a cluster’s files have been marked with a custom attribute, either manually or as part of a custom application or workflow, they will then be moved to the Archive_1 tier upon the next successful run of the SmartPools job.
The file system explorer (and ‘isi get –D’ CLI command) provides a detailed view of where SmartPools-managed data is at any time by both the actual Node Pool location and the File Pool policy-dictated location (i.e. where that file will move after the next successful completion of the SmartPools job).
When data is written to the cluster, SmartPools writes it to a single Node Pool only. This means that, in almost all cases, a file exists in its entirety within a Node Pool, and not across Node Pools. SmartPools determines which pool to write to based on one of two situations:
- If a file matches a file pool policy based on directory path, that file will be written into the Node Pool dictated by the File Pool policy immediately.
- If a file matches a file pool policy which is based on any other criteria besides path name, SmartPools will write that file to the Node Pool with the most available capacity.
If the file matches a file pool policy that places it on a different Node Pool than the highest capacity Node Pool, it will be moved when the next scheduled SmartPools job runs.
For performance, charge back, ownership or security purposes it is sometimes important to know exactly where a specific file or group of files is on disk at any given time. While any file in a SmartPools environment typically exists entirely in one Storage Pool, there are exceptions when a single file may be split (usually only on a temporary basis) across two or more Node Pools at one time.
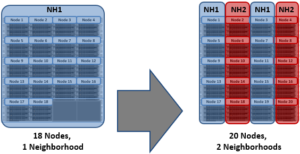
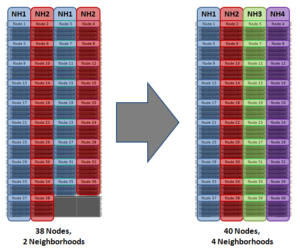
SmartPools generally only allows a file to reside in one Node Pool. A file may temporarily span several Node Pools in some situations. When a file Pool policy dictates a file move from one Node Pool to another, that file will exist partially on the source Node Pool and partially on the Destination Node Pool until the move is complete. If the Node Pool configuration is changed (for example, when splitting a Node Pool into two Node Pools) a file may be split across those two new pools until the next scheduled SmartPools job runs. If a Node Pool fills up and data spills over to another Node Pool so the cluster can continue accepting writes, a file may be split over the intended Node Pool and the default Spillover Node Pool. The last circumstance under which a file may span more than One Node Pool is for typical restriping activities like cross-Node Pool rebalances or rebuilds.