The previous articles in this series have covered the SmartQoS architecture, configuration, and management. Now, we’ll turn out attention to monitoring and troubleshooting.
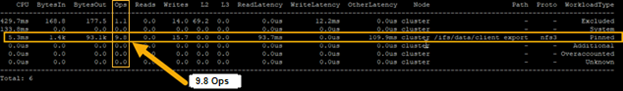
The ‘isi statistics workload’ CLI command can be used to monitor the dataset’s performance. The ‘Ops’ column displays the current protocol operations per second. In the following example, OPs stabilize around 9.8, which is just below the configured limit value of 10 Ops.
# isi statistics workload --dataset ds1 & data
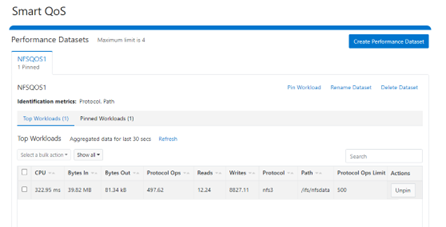
Similarly, this next example from the SmartQoS WebUI shows a small NFS workflow performing 497 protocol OPS in a pinned workload with a limit of 500 OPS:
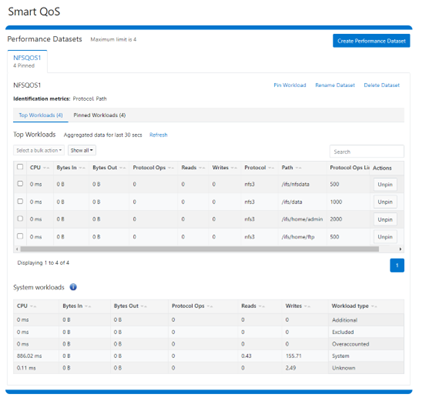
Multiple paths and protocols can be pinned by selecting ‘Pin Workload’ option for a given Dataset. Here, four directory path workloads are each configured with different Protocol OPs limits:
When it comes to troubleshooting SmartQoS, there are a few areas that are worth checking right away, including the SmartQoS Ops limit configuration, isi_pp_d and isi_stats_d daemons, and the protocol service(s).
- For suspected Ops limit configuration issues, first confirm that the SmartQoS limits feature is enabled:
# isi performance settings view
Top N Collections: 1024
Time In Queue Threshold (ms): 10.0
Target read latency in microseconds: 12000.0
Target write latency in microseconds: 12000.0
Protocol Ops Limit Enabled: Yes
Next, verify that the workload level protocols_ops limit is correctly configured:
# isi performance workloads view <workload>
Check whether any errors are reported in the isi_tardis_d configuration log:
# cat /var/log/isi_tardis_d.log
- To investigating isi_pp_d, first check that the service is enabled
# isi services –a isi_pp_d

Service 'isi_pp_d' is enabled.
If necessary, the isi_pp_d service can be restarted as follows:
# isi services isi_pp_d disable

Service 'isi_pp_d' is disabled.

# isi services isi_pp_d enable

Service 'isi_pp_d' is enabled.
There’s also an isi_pp_d debug tool, which can be helpful in a pinch:
# isi_pp_d -h

Usage: isi_pp_d [-ldhs]

-l Run as a leader process; otherwise, run as a follower. Only one leader process on the cluster will be active.

-d Run in debug mode (do not daemonize).

-s Display pp_leader node (devid and lnn)

-h Display this help.
Debugging can be enabled on the isi_pp_d log file with the following command syntax:
# isi_ilog -a isi_pp_d -l debug, /var/log/isi_pp_d.log
For example, the following log snippet shows a typical isi_ppd_d.log message communication between isi_pp_d leader and isi_pp_d followers:
/ifs/.ifsvar/modules/pp/comm/SETTINGS

[090500b000000b80,08020000:0000bfddffffffff,09000100:ffbcff7cbb9779de,09000100:d8d2fee9ff9e3bfe,090001 00:0000000075f0dfdf]

100,,,,20,1658854839  < in the format of <workload_id, cputime, disk_reads, disk_writes, protocol_ops, timestamp>
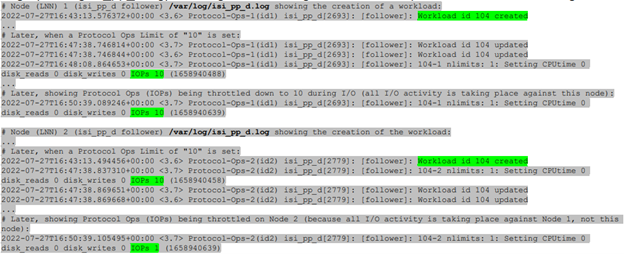
Here, the extract from the /var/log/isi_pp_d.log logfiles from nodes 1 and 2 of a cluster illustrate the different stages of Protocol Ops limit enforcement and usage:
- To investigate the isi_stats_d, first confirm that the isi_pp_d service is enabled:
# isi services -a isi_stats_d
Service 'isi_stats_d' is enabled.
If necessary, the isi_stats_d service can be restarted as follows:
# isi services isi_stats_d disable

# isi services isi_stats_d enable
The workload level statistics can be viewed with the following command:
# isi statistics workload list --dataset=<name>
Debugging can be enabled and on the isi_stats_d log file with the following command syntax:
# isi_stats_tool --action set_tracelevel --value debug

# cat /var/log/isi_stats_d.log
- To investigate protocol issues, the ‘isi services’ and ‘lwsm’ CLI commands can be useful. For example, to check the status of the S3 protocol:
# /usr/likewise/bin/lwsm list | grep -i protocol
hdfs                       [protocol]    stopped
lwswift                    [protocol]    running (lwswift: 8393)
nfs                        [protocol]    running (nfs: 8396)
s3                         [protocol]    stopped
srv                        [protocol]    running (lwio: 8096)

# /usr/likewise/bin/lwsm status s3
stopped

# /usr/likewise/bin/lwsm info s3
Service: s3
Description: S3 Server
Categories: protocol
Path: /usr/likewise/lib/lw-svcm/s3.so
Arguments:
Dependencies: lsass onefs_s3 AuditEnabled?flt_audit_s3
Container: s3
The above CLI output confirms that the S3 protocol is inactive. The S3 service can be started as follows:
# isi services -a | grep -i s3
s3                   S3 Service                               Enabled
Similarly, the S3 service can be restarted as follows:
# /usr/likewise/bin/lwsm restart s3
Stopping service: s3
Starting service: s3
To investigate further, the protocol’s log level verbosity can be increase. For example, to set the s3 log to ‘debug’:
# isi s3 log-level view
Current logging level is 'info'

# isi s3 log-level modify debug

# isi s3 log-level view
Current logging level is 'debug'
Next, view and monitor the appropriate protocol log. For example, for the S3 protocol:
# cat /var/log/s3.log

# tail -f /var/log/s3.log
Beyond the above, /var/log/messages can also be monitored for pertinent errors, since the main partition performance (PP) modules log to this file. Debug level logging can be enabled for the various PP modules as follows
Dataset:
# sysctl ilog.ifs.acct.raa.syslog=debug+
ilog.ifs.acct.raa.syslog: error,warning,notice (inherited) -> error,warning,notice,info,debug
Workload:
# sysctl ilog.ifs.acct.rat.syslog=debug+
ilog.ifs.acct.rat.syslog: error,warning,notice (inherited) -> error,warning,notice,info,debug
Actor work:
# sysctl ilog.ifs.acct.work.syslog=debug+
ilog.ifs.acct.work.syslog: error,warning,notice (inherited) -> error,warning,notice,info,debug
When finished, the default logging levels for the above modules can be restored as follows:
# sysctl ilog.ifs.acct.raa.syslog=notice+

# sysctl ilog.ifs.acct.rat.syslog=notice+

# sysctl ilog.ifs.acct.work.syslog=notice+